Original Air Date: January 25, 2017

Original Air Date: January 25, 2017

Original air date: January 11, 2017

Original air date: December 12, 2018

Original air date: October 25, 2022

original interview October 11, 2017

Let’s say I want to create a better eat-at-home meal solution for work-from-home professionals. That’s not really a strikingly novel problem. Indeed, food and beverage services are some of the oldest businesses in existence. I will face fierce competition to do the job. Why will customers choose my solution and not those of my competitors?
Maybe because I do a better job of advertising, or because my product is more available, or because it’s priced lower. Those things are important for sure. But, much more significant, customers will choose my product if it better meets their needs.
The second diamond in the triple-diamond design process begins with a job to be done, understands the customer needs, and identifies one or more insights. There are two key goals of the second diamond. The first is to comprehensively catalog your customers’ needs. The second is to identify one or two latent needs – needs that are important but not yet addressed in the marketplace. We call these latent needs insights and they are useful in pulling a compelling solution concept when we get to the third diamond.

We aren’t here only talking about fundamental human needs in the sense of food, shelter, and belonging. Rather, for any given job to be done, customers typically care about 30 to 50 distinct attributes of a potential solution that if provided will result in greater satisfaction. We call these attributes needs, and they tend to vary a lot across individuals. For example, consider these two products. First, the Wendy’s Pretzel Bacon Pub Triple Cheeseburger. Second, the Soylent liquid meal. Both are solutions to the job “How might we provide lunch to hungry workers?” But, clearly the burger is better at meeting the primal craving for fat and salt, and the Soylent is better at meeting the need for high efficiency.


You have a focal customer, or type of customer, sometimes called your beachhead market, and represented by your customer persona. Once you have specified the target segments, a goal of the second diamond is to create a comprehensive list of user needs. There are entire textbooks that teach the methods for understanding user needs. In fact, I am a co-author of one of them (Ulrich et al. 2020). Here is an example of a comprehensive list of customer needs for a music player.

In sum, you create this list by doing a set of open-ended interviews with individual potential customers. You interpret what you hear and see in terms of the individual underlying needs.
You do your best to express these needs independently of solution concepts. So, instead of stating that the music player has a touch screen enabling a finger to rearrange the order of a playlist, you state that the music player allows the user to predetermine a sequence of songs, a statement independent of any particular solution concept.
Once you have a comprehensive set of unique needs, you arrange them into clusters. For example, the primary need “The music player lets me control the music” is supported by a cluster of secondary needs that are more specific and detailed like “The music player lets me easily find and play music I have enjoyed previously” and “The music player lets me reduce frequency of play of a song.”
The full needs list is important for the ultimate product design. After all, you don’t want to miss anything important. You may also at some point use more formal quantitative customer research tools in order to understand which needs are most important across different market segments and the relative importance of say price and convenience for a particular segment. But, in the triple diamond model of design, our goal is the development of a compelling solution concept, and for that purpose, we are doing an initial exploration of customer needs in order to understand the important unmet needs among our potential customers – what we call an insight.
A woman named Emily Harper recently posted a video on the social media site TikTok showing how she prepares ground beef for use in recipes. With the comment that all this fat is disgusting, she is shown first cooking the meat and then washing it thoroughly with hot water using a wire strainer. The video went viral with seemingly half the world aghast that she had removed all the flavor from her food, and the other half thrilled at this revelation of a new technique for healthy living.
Your job as a zero-to-one product leader is not to pass judgment on crazy customer behavior. Rather, you benefit from acting like an anthropologist and asking yourself what deep insight does this behavior reveal about the nature of your potential customers.
In thinking about the opportunity for 99 Bowls, a service providing immediately available yummy food for work-from-home professionals, I hope to observe Emily with a curious and open mind.
The insight I derive from watching Emily going to extreme lengths to adhere to strict dietary constraints is that some individuals feel a compelling need to tightly control the macro nutrient profile of the food they eat.
Among designers, the term insight refers to a user need that is:
Authentic means that the insight is based on an actual observation of users in the target market.
Non-obvious is self explanatory.
Significant means that if your solution addresses the need it would result in a meaningful enhancement in the value perceived by the customer.
In the second diamond of the triple-diamond model the designer achieves two goals: first, comprehensively identify the customer needs in the target segment and second, flag a small subset of those needs that comprise insights.
The result of a set of customer needs interviews is a comprehensive list of customer needs, usually 30-50 distinct items. These needs can be sorted into four categories, illustrated by a framework from the Japanese total quality movement of the 1980s and 1990s called a Kano Diagram.

The horizontal axis is the extent to which the need is satisfied by the solution. The vertical axis is the resulting change in customer satisfaction, or perceived value of the solution.
The “don’t care” needs are needs that are irrelevant to the customer. Address them or not – the customer’s satisfaction does not change. For example, for me, whether or not the food you deliver to me is gluten free, I don’t notice or care.
The “linear” needs are those for which the customer’s satisfaction is essentially directly proportional to the extent to which your solution addresses the need. For example, affordability is often a linear need. When the food is a little more expensive, I’m a little less satisfied.
The “must haves” are needs that if fully addressed do not result in dramatic improvements in satisfaction, but if not addressed at all, result in extreme dissatisfaction. For example, if a food container is microwavable, I don’t particularly notice. However, if the container immediately melts or sparks in the microwave, I’ll be very dissatisfied.
The “latent” needs are needs that if unaddressed are not missed, but if addressed result in surprise and delight. For example, if my food service allows me to precisely specify the macronutrients of my lunch, say 20% carbohydrates, 40% fat, and 40% protein, I’m thrilled.
While there have been some attempts to use the Kano framework quantitatively based on survey methods, it’s mostly conceptual. It gives you a way to think about customer needs and to direct your investment. Ignore the don’t cares. Deliver the must-haves. Invest at competitive parity in the linear needs. But, then, seek out the latent needs like hidden gems. The latent needs are by definition non-obvious. To the extent that they derive from your observation of users, they are authentic. Those that are significant – a big deal for customers if addressed – are insights. These insights will be used in the third diamond to pull compelling solution concepts.
OK, but how do I actually get the information to identify the customer needs. Put simply, you get out of the office and interact with customers.
More specifically, you conduct at least 10 one-on-one interviews for each distinct market segment. For new zero-to-one products you’ll probably just have one beachhead market. Perhaps surprisingly, you need just 10 interviews to identify 90 percent of the customer needs that would eventually be revealed by interviewing hundreds of customers.
I recommend you do these interviews as follows:
The triple diamond model of design is highly effective in understanding latent customer needs and in developing novel solution concepts in response to those needs. However, it has no mathematical underpinnings. There is no notion of statistical significance or estimation of the magnitude of a consumer response to a given feature. Many of you probably have backgrounds in engineering, economics, or mathematics and may be uncomfortable relying on such a qualitative process to create new products.
Of course your discomfort is justified. After all, in business we do really need to answer questions like how big is the addressable market? What should our price point and product specifications be? How will our new product fare in a competitive landscape?
These and other important questions are best answered with quantitative market research tools.
But be careful – the triple-diamond model is intended to engage you in a rich and multi-sensory way with the customer. You won’t achieve that goal with a web-based survey. Avoid the impulse to employ quantitative market research techniques until after you have used the customer-centered, qualitative approach captured by the triple diamond model.
Ulrich, Eppinger, and Yang. 2020. Product Design and Development. McGraw-Hill.
List of highest-calorie fast-food burgers available in the United States. https://www.eatthis.com/fast-food-burgers-highest-calories/
Wikipedia description of Kano Model. https://en.wikipedia.org/wiki/Kano_model

The triple diamond model is a user-centered approach to design and concept development. The first two diamonds really focus on better defining the “what” – who is our customer, what is the job to be done, and what needs are potentially most relevant to them. In this chapter, we turn to the “how”? Given an understanding of the customer and the job to be done, how can we create a great solution? For this, we use the third diamond, another cycle of divergent and convergent thinking.

I want to underscore that the tools and approaches in this chapter have two contexts for application. First, these tools are used to create a great solution concept in the context of zero-to-one product development – say the original concept for the Strava fitness app. Second, these tools can be used in the daily work of individuals and teams for any kind of design challenge, say improving the social networking features within the Strava app, or even for internal innovation problems like how we might increase retention of customers on the Strava platform.
The goal of the triple diamond model is to deliver a great solution concept. But, what makes for a great concept?
A concept is a preliminary description of how you plan to do the job for the customer.
For physical goods, it’s usually a sketch of the physical embodiment of the solution. For example, here are 10 concepts that were generated by two of the students in my product design class at the University of Pennsylvania to do the job of carrying an ID card, a key, and perhaps a mobile device unobtrusively underneath clothing. They called the resulting product the underwallet. They did a particularly nice job of illustrating these concepts by hand.

For services, the concept is often illustrated with a visual storyboard, or possibly simply with a paragraph of text.
For software, the concept is usually illustrated with the screens that comprise the user interface on a mobile device or desktop computer.
Not all concepts are equally good. Here are the four characteristics that I believe make for a great concept.
The first and most important characteristics of a great concept is that it addresses the needs of the customer.
Here’s an example. I love Google Docs. The concept is a word processing tool that runs in the web browser with no downloads or installation required. The file is stored in the cloud and is backed up automatically with a history of prior versions. The file can be accessed from any device, including my mobile phone, or from multiple devices simultaneously. Search works great, allowing me to find a document with just a few keystrokes. The software is clean, simple, and fast. I can share a file with anyone or everyone with a couple of clicks. I can export the document as a PDF file if necessary. Other than one tiny complaint about how bullets are formatted, this product is perfect for my needs.

The second characteristic of a great concept is that it is cost efficient. Here is an example of a cost-efficient packaging concept. Many of you probably know about GLIDE dental floss. It was pioneered by the company WL Gore. It’s made from Teflon or polytetrafluoroethylene. The compound is very slippery and so glide is particularly valuable to customers whose teeth are tight up against each other. Thus, the name Glide.
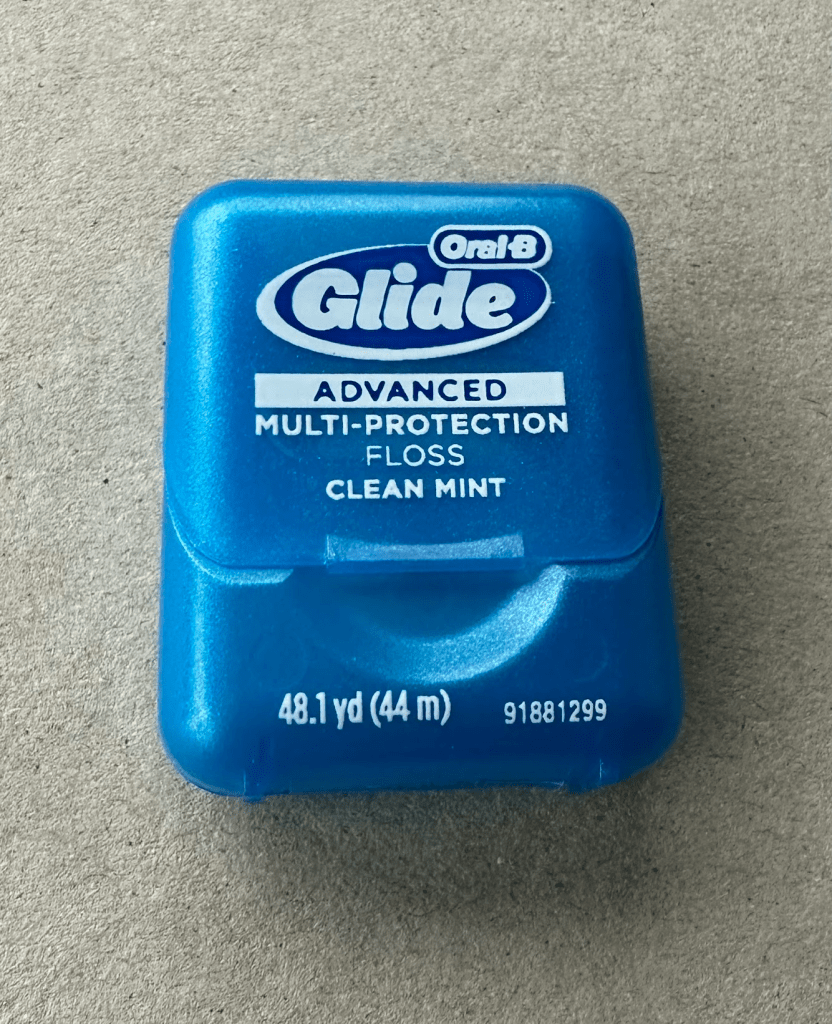
Glide itself is an interesting product, but it’s the package that I want to talk about for a minute. The Glide floss package is a single injection molded part designed with a living hinge that allows it to both fold into the deployed configuration, include an integral cap, and to be configured in a way that it can be molded as a single piece, and in a way that the part can easily come out of the mold.

My guess is that the manufacturing cost of this package is a few cents. Although the smooth pebble-like form is unobjectionable, the glide concept really shines not because of its beauty or function, but because of its extreme cost efficiency.
The third characteristic of a great concept is what I call the wow factor. Here’s an example. I have an app on my mobile device called “Picture This.” I was riding my mountain bike this past summer and sat down for a rest. I smelled an interesting minty fragrance, which seemed to be coming from foliage near my feet. I snapped a photo using PictureThis and within seconds the app told me I was looking at Mountain Monardella, also known as mountain coyote mint. Who knew? Picture This has a bunch of nice features including the ability to keep a database of plants previously identified. But, the wow evoked when some image processing algorithm identifies a plant from a snapshot is magic.

The wow factor is valuable for at least two reasons. First in a commercial context, if you have some wow, then you typically also can achieve some intellectual property protection, usually in the form of a patent. This can provide a modest and temporary barrier to competitors replicating your design.
The second reason, and perhaps the more important reason, is that if you’ve got some wow in your concept, then you have something to talk about in the market, and you can get a user excited about the product. In a commercial setting it allows for your product to distinguish itself from the competing alternatives.
The fourth and final characteristic of a great concept is aesthetics and elegance. That is, as designers we should strive to create things that are beautiful. I can wax on about the beauty of purely functional objects, but automobiles are perhaps more interesting examples because they embody a complex bundle of function, identity, and meaning. When Volkswagen announced its all electric microbus, it revealed a concept to which a lot of attention had been paid to aesthetics, including a careful and tasteful reflection of the heritage of the original VW van.

OK so those are objectives. We want to create something that meets user needs, can be produced at low cost, has some wow, and is beautiful.
The four elements that make for a great concept are particularly important for physical goods and for services. In both physical goods and services, cost is critically important. However, for digital goods, cost is usually less important.
Furthermore digital goods can often be thought of more as bundles of features than as a single distinctive solution concept. These features can be added and subtracted incrementally over time as the product evolves.
Perhaps in part for these reasons, the development of a great concept tends to receive less attention for digital goods than it does for physical goods or services. Zero-to-one product managers sometimes feel that a software solution concept follows directly from the job to be done and the customer needs, and even if it doesn’t, the solution can be refined over time.
I think this view is a mistake. Digital goods offer almost unlimited flexibility in solution approach, so if anything, a thorough exploration of the solution landscape is even more important in digital goods than it is in physical goods.
Let me give you a few examples of distinctive concepts in digital goods.
Twitter – what’s the concept? A social network organized around the idea of followers in which an individual creates a virtual bulletin board, usually viewable by the public, in which messages of 144 characters or less are posted chronologically. Messages are pushed to followers and appear on a scrollable feed. (Of course many features have been added over the years, including direct messaging, the ability to respond to tweets, the ability to like tweets and so forth, but the original and still essential concept is quite distinct.)
Slack – what’s the concept? SMS/Txt for work, organized around topical channels. The big idea is to consolidate information and discussions into threads by topic to avoid the chaos of email. Again, many additional features have been added over time, including document sharing, emoji responses, push notifications and so forth. But, the big idea remains asynchronous communication for work organized by topic.
Tinder – what’s the concept? A mobile-only dating app focused on photos, in which individuals express interest in a potential partner by swiping an image to the right, and rejecting a potential partner by swiping an image to the left. When and if two parties swipe right on each other, the app declares a match and allows the two parties to start a conversation via text message.
Strava – a GPS-enabled fitness app, originally focused on running, in which an individual’s route and running time are automatically recorded, and then shared with a network of other runners. The route is automatically divided into segments and a leaderboard is established for the fastest times along those segments.
Because these concepts have been so successful, we take them for granted, even assuming that there could only be one way to do things. But, that perception reflects a hindsight bias.
There are a huge number of possible solution concepts for virtually any problem domain. For example, consider the simple task of listening to pre-recorded music using a digital device. What are the different ways that might be done?
One early solution, Apple iTunes, had these key elements. The iTunes store in which you could buy individual songs, originally for USD 1 each. Then, local storage of those songs in a master library on a physical device. Then, the creation of playlists from the master library. That was it.
A very different, and quite revolutionary concept arrived with the service Pandora. With Pandora, a user simply typed a single song or artist into a web-based application and Pandora created a virtual radio station based on other songs that shared the same “music genome” – Pandora’s name for the distinctive musical elements of a song. No need to create playlists. Pandora does it for you, and you can have as many stations as you want for free, if you are willing to listen to some audio advertisements, or if not, for a single monthly subscription fee.
Then, Spotify came along with an all-you-can-eat subscription service in which you could create playlists from extensive available catalogs, but without actually having to own and keep track of the digital content itself.
Today, YouTube Music is a significant player in the music space. The insight addressed by YouTube is that in many settings people really want the option of viewing video of the artists from live performances or highly produced visuals.
I know some of you are thinking that these different ways of listening to music are now blended together on many platforms. For example, Spotify allows for downloading of files for off-line listening and allows for the use of Pandora-like stations. By the way, I recommend the “dinner chill” station for nice music for dinner parties.
This convergence is a reflection of the massive amount of experimentation and innovation that competitors have engaged in over about two decades at the beginning of this century. At some point preferences of customers became clear, market segments came into focus, and the solution concepts matured and became fairly stable. This is the normal pattern of evolution in an industry.
The maturation of the approach an industry takes to doing a job is another reason concept development may not be emphasized as much as it should be for digital goods. So often the product manager joins the team long after the original solution concept was established. Anyone joining Strava today as a product manager would not likely be doing a zero-to-one design for a new app, but rather would be improving and tuning an existing app. Still, even in this context, the skill of concept development is important. Even if you are working on some small feature within a larger established product context, you should strive for a solution concept that meets needs, is cost efficient, has some wow, and is beautiful.
The essence of the third diamond in the triple diamond model is another cycle of divergent and convergent thinking.
Concept generation and selection is essentially a mini tournament of ideas. We’re going to generate a lot of alternatives; a dozen or maybe even a hundred different solution concepts. We’re then going to select from among those in order to find an exceptional concept. For most people this does not come naturally. The good news is that as with most challenges in life, a little bit of process and practice goes a long way.
Before we get into the mechanics of how to actually do this, I want to emphasize three points.
First, I want to emphasize that concept generation is really hard. It takes much more effort than most people appreciate. I do not want to sugar coat this reality. Here’s an example to illustrate what I mean.
Some of you might have noticed a little stick figure in some of my illustrations. The stick figure is one element of one graphic in a few sessions of one of my courses. There are hundreds of such elements.

But that little stick figure concept is the result of deliberate exploration. I went back through my files and I found this sheet showing more than 100 different alternatives for what that stick figure might look like. I eventually found one that I thought worked quite well. Some of you are rolling your eyes and thinking how can it possibly be worth investing that kind of effort in a stick figure. You could be right.

But, the point I want to make here is that the tiniest design challenge when done well still requires tremendous effort. This is hard work. You need to be prepared to do the hard work to get great outcomes.
As a slight aside, let me make a comment about life and professional success more generally. You should embrace things that are hard, especially when by hard, I really mean just putting in the effort. If you can internalize the idea that great concepts are mostly the result of hard work, while others believe a spark of creative genius is required, then you have a superpower. You can be confident that if you do the work using a solid process, you are going to get better results than everyone else, and all you have to do is show up and do the work.
The second point I want to make about exploration is that we need to be open to ideas that come from anywhere and everywhere. Sometimes it’s even dumb luck that leads to a great design concept.
Here’s an example. I’m the inventor of a product called the Nexride bicycle seat. Let me tell you where the concept came from. A few years ago I was working on creating a better bicycle seat. As part of the process I was testing out several of the existing non-traditional products. I was out riding one of the saddles that’s essentially a bench-shaped form mounted perpendicular to the direction of travel.
So, I’m out riding about 30 kilometers from home when the clamp that attaches the seat post to the frame breaks. This meant not only that the seat fell down so that it was right up against the frame, but also that it was free to pivot side to side. I considered walking home, but then decided I should try to ride the bike anyway, as that approach would still be faster than walking. To my dismay I discovered that the pivoting action allowed by the lack of a rigid clamp made the saddle much more comfortable. It allowed the bench to get out of the way as my leg extended on the down stroke.
I immediately went home and created a prototype of a pivoting bike seat, and I eventually ended up inventing a new saddle, the Nexride bicycle seat.

I say “invent” but really that concept came from a dumb accident – a broken bolt out on a bike ride. I’m not complaining. In fact, I’m emphasizing that you need to be open to the possibility of ideas from any source including random occurrences.
Lastly I want to point out that even though we have a process, and I am going to teach you some methods for doing exploration, please understand that concept generation tends to be highly iterative. It’s quite likely that as you generate ideas, the definition of your job to be done will come into better focus. It’s also quite possible that as you proceed to refine a particular concept and build and test prototypes, you’ll have additional ideas for new concepts. That’s normal. Don’t be alarmed. That iteration is fundamental to the way design happens in practice.
A few years ago I founded a company called Terrapass. We provided a service to offset the environmental footprint of driving a car. Given the complexity of understanding what and how we actually mitigated environmental damage, we settled on a solution concept that was very simple. For one fixed fee, USD 79 per year, we would provide enough carbon dioxide credits to offset the emissions of your car. See, it’s really, really hard to explain the product clearly. Still, what we discovered was that our customer was really interested in the details, and had a deep appetite for understanding the nuance of the environmental impact of driving. We found that we had to modify our concept, and actually increase complexity by adding a highly customizable emissions calculator to our website. This solution allowed the customer to precisely specify the make and model of their car, the amount of driving they did, and their driving habits. Iteration on the solution concept is usually required in order to achieve great outcomes.
I’ve mostly talked about the third diamond in generalities. Let’s dive into the details, starting with the divergent part. How can you reliably generate a lot of solution concepts?
The human mind is pretty good at thinking of solution concepts, especially after considering carefully the job to be done and engaging with the customer. So, before getting too fancy, just write down or sketch out any ideas you have from the top of your mind. In my experience, you already have at least three or four ideas.
Now comes the part that really differentiates expert creators from novices. Just put those ideas aside. They may eventually prove to be the best solution to the job at hand. But, experts know that those ideas are not going away. You’ve already captured them. So, just let them go for now. Move on and see if you can generate another half dozen or more alternatives.
You can use some simple techniques to stimulate your thinking. Here are five that I like.
First, pull from insights. You’ve already invested heavily in the second diamond, understanding the customer, and that effort should have produced a couple of insights. Insights are customer needs that are authentic, non-obvious, and significant. I guarantee you that if you identify an insight, a solution concept will just fall out of your mind.
Let’s try it. My hoped-for new venture 99 Bowls makes and ships frozen prepared lunch foods like soups, chowder, and chili to professionals working from home. In my customer research, I identified the insight that many people strive to tightly control the macro nutrient profile of their food. For example, some want higher fat and lower carbohydrates, and others low fat and high protein. Can you think of any solution concepts for 99 Bowls that would be responsive to that insight?
Of course you can. Here are a few. How about starting with standard recipes, say for chili (a mexican-inspired spicy soup), but whose ingredients can be adjusted in a custom production process to deliver a pre-specified macro nutrient profile? Want higher fat and lower protein? Increase the amount of cheddar cheese and reduce the amount of ground turkey. Want higher carbohydrates? Substitute corn kernels for the cheddar. Another would be to have a vast assortment of soups, but then to automatically filter the options to those that satisfy the customer’s desired nutrient profile. A third option would be a sort of bento box that assembles different food items – say sliced turkey, pita chips, hummus, and cheese – into a lunch portfolio that satisfies the overall target nutrient profile.
In fact, the whole purpose for finding those insights in the first place is to use them to pull distinctive solution concepts. This technique is the most powerful item in your concept generation tool kit.
A second approach is to apply the decomposition principle, focusing on just one element of the job to be done. You can decompose by customer needs, which is essentially what we do when focusing on an insight, or you can decompose by sequence of user actions or according to different sub-functions within a larger solution. For example, for 99 Bowls we might decompose the overall service into selection, ordering, delivery, and consumption. Now, focus on just one of those functions and consider all the different ways you might do it. For instance, consider delivery. 99Bowls could ship a carton of 12 individual servings that are frozen and placed in insulated packaging. Or, the customer could pick up a month’s supply at a regional refrigerated drop-off point. Or, a single serving could be delivered ready to eat at a pre-specified time each day. Or, the company could locate a compact freezer in apartment complexes and neighborhoods acting as a sort of vending machine for meals that have been pre-purchased. We could follow the same process for the other sub-functions, say selection. Once the decomposed problem has been tackled, pieces that work together can be assembled into complete solution concepts.
In a third approach, consider how an organization with a distinctive approach to product would solve the problem. For example, how would the Japanese household products company Muji implement 99 Bowls? I’m envisioning very tidy and beautiful containers, likely rectangular in shape that stack into a modular storage and shipping solution. The containers are either reusable or returnable. How would Nike do it? Maybe with selections endorsed by famous athletes – say the Michael Jordan meal plan. How would Netflix do it? They would make meal suggestions based on my eating history. You get the idea – take the best elements of the distinctive approaches of other companies and see how they might apply to your challenge.
Fourth, consider analogous problem domains. 99 Bowls is trying to solve the problem of what’s for lunch while working from home. What’s an analogous problem? Maybe the problem of what to watch at home in the evening. How do I solve that problem? I have different channels and platforms like YouTube, Disney, HBO, and Hulu. Maybe I can have different lunch channels, with varied offerings.
Fifth, set a numerical goal. I generally like to use a goal of 10 distinct solution concepts. Over thirty years of teaching product development, I’ve found that the number 10 is challenging, but achievable. If you have identified 10 distinct ways to do a job, you have probably done a decent job of covering the landscape.
All else equal, the easiest way to find a better idea is to generate more ideas. And, the easiest way to generate more ideas is to engage more people. Engage your team. Engage your engineers. Engage your customers. Ask anyone who will listen if they have suggestions or ideas about how to do the job.
One technique I like when working with a team, is to prepare in advance a list of what I call Emergency Stimuli. These are prompts that might dislodge new ideas. Here’s an example of some stimuli for the 99 Bowls challenge.
In my experience, almost any prompt will work to get team members unstuck. Just think of a handful of questions that can nudge people to think differently, and then use those questions when and if the ideation process gets stalled or people complain they are out of ideas.
The divergent portion of the third diamond is all about generating a lot of alternatives. There’s no shortcut, other than perhaps the trick of involving a lot of people, which certainly makes the task easier. Apply the process, do the work, engage a team, and you’ll end up with a rich set of solution concepts.
Some projects are completed by individuals working alone, but more typically you will find yourself in a team. How can you most effectively harness the power of individuals and groups to generate concepts?
The most common organizational practice is to call a meeting and to conduct a brainstorming session. You’ve all done this. You get a group of people around the table. Maybe you have a flip chart and an easel or a whiteboard, and someone facilitates the meeting.
I exaggerate only slightly in saying that this is probably the single worst thing you can do in order to effectively deploy your team.
Let me make an analogy. Imagine that you and your team are on a small plane that crashes on a remote island. Everyone survives but your first task at hand is to find food, water, and shelter – this is the metaphorical equivalent of looking for a great solution concept.
Now imagine two strategies. In the first, the team huddles together in a rugby scrum and you wander around as a group looking at the ground together. That’s the equivalent in organizational life to calling a meeting.
In a second scenario, everyone on the team heads off in different directions, with the mandate to come back and report on what they found after 30 minutes. Then, after sharing information you all go look more carefully in the most promising areas.
Hopefully your intuition is that the second approach will more reliably find the best food, water, and shelter. This same strategy of employing independent parallel exploration is also the best way to engage a group in concept development.
You don’t have to take my word for it. My colleagues Christian Terwiesch, Karan Girotra, and I have tested this idea experimentally. We compared two different approaches to ideation. In what we call the group approach, four people work together for 30 minutes. In a second technique, we call the hybrid approach, those same four people work for 10 minutes alone as individuals independently and in parallel and then those four people work together for 20 minutes exploring the ideas that they generated alone as individuals.
We did this study with 44 individuals divided into 11 groups of 4 and we had them work on exploring for alternatives for two different product design problems.
We found that with the hybrid approach the same 4 individuals could generate about 2 – 1/2 times more ideas if they took the hybrid approach than if they worked together as a group.
Not only that but the ideas they generated were actually better in quality as well.

We have unambiguous evidence that a hybrid process is better than a group process and that you need to have an individual phase for at least some of your exploration effort.
It’s very helpful to provide a numerical target for that individual phase. I usually use a goal of 10 ideas per individual.
Lastly, some people find out that it’s very hard in some organizations to actually get people to do their homework – that is to actually do the assigned work of generating 10 ideas working individually.
If that’s the case for you, then I recommended you go ahead and call a meeting, which is effective in getting people to allocate some time. But then after you’ve called the meeting and after you’ve got people together, you ask them to work alone for the first 10 minutes, after which you can proceed to work together as a group.
Just to be sure I’m clear, I want to reiterate that I’m not opposed to working in teams. Rather, you should cherish the value of the team resource and work to deploy it most effectively, by having your team members spend some time working individually and alone before you bring together team members into a group process.
The third diamond in the triple-diamond model includes a convergence from many solution alternatives to a single plan for going forward. We clearly shouldn’t pick from our alternatives at random. How do we converge?
In most cases, the convergence comprises two steps. First, the team, without the benefit of any external testing, narrows a set of 10 or more solution alternatives to a few, say 2 or 3. Second, some kind of testing with potential customers is used to converge on the best single solution. Here I focus on the first step – screening and selecting internally.
The technique used most widely in practice is multi-attribute utility analysis — which is an overly fancy name for a criteria matrix. Even if you don’t know the technical name, you’ve probably used one of these tables before. In this example I use a google sheet to quickly create the matrix, but any table will do, even a marker on a whiteboard.
Just as an arbitrary convention, I like to use the columns for the different solution alternatives and the rows for the criteria.

A desirable characteristic of a structured selection method is that you can remember, codify, and communicate the logic behind a decision long after it has been made. The selection matrix is self documenting. So, if you do use a whiteboard, remember to snap a photo for archival purposes.
For physical goods, I find it is sometimes nice to draw a little sketch next to the textual description of the concept at the head of each column. You can also use a separate document with illustrations to document in more detail each of the concepts captured by the matrix.
The rows of the matrix are the selection criteria. I like the criteria to be the key customer needs. In this example I’ve shown three needs – quick and easy to use, removes all the ice cream from the container, and forms a nice ball. Almost always there are three additional criteria that apply, and they are cost or some measure of the economic efficiency of delivering the solution, wow, that is how fundamentally interesting and novel is the solution, and elegance and beauty. These criteria map directly to the universally desirable attributes of a solution concept.
Now you just consider the relative performance of each concept relative to the criteria. The convention that I like to use for representing relative performance is a three level scale using a plus, a zero, and a minus.
Note that even though I use the term cost here, I adopt the convention that plus is always better, and minus is always worse, so a plus indicates lower cost.
Once you’ve evaluated all of the concepts relative to all of the other criteria, you can then summarize the net score by adding up plusses and subtracting minuses for each concept.
One positive outcome of the selection process is that it helps the team to realize when elements of one concept might be combined with another, or when concepts are actually quite similar to each other. For instance, as a result of this process, I discovered that concept E was conceptually very similar to concept G, a concept that I ended up pursuing further.
In this example, two concepts really stood out as superior, and so I focused on those two for further development. I often see three concepts that emerge as most promising. Rarely does a team have more than three really compelling concepts based on this internal selection process.
Now those of you who are more right brained have an objection. You argue that we can’t really reduce everything in life to a quantitative evaluation. Instead you need to make a more holistic judgment of the qualities of the concepts.
I hear you on this point, and I think it’s good discipline to see if you can get the concept selection matrix to be consistent with your intuition. That suggests that you’ve been able to capture what’s really behind your intuition, and that will benefit you when you go to communicate your rationale to other people, maybe to the more left brain of the stakeholders on the project.
[As a complete aside, I know remembering what those terms left brain and right brain mean is really hard – they are terrible labels. Here’s the mnemonic device I use. Remember that LEFT is LOGICAL…]
Those of you who are more left brained have your own objection. You argue that not all criteria are equally important and that it’s hard to reflect accurately the relative quality of concepts using just three levels.
Of course both of these concerns are valid. For this quick selection method to be effective, the criteria need to be roughly equal in importance, and in some cases, a crude three-level quality rating will mask some huge differences in relative quality of concepts. You can of course easily modify the criteria matrix to increase the number of quality levels, say using a 1 to 5 scale, and you can weight the relative importance of the criteria using a percentage weighting scheme or a point system. However, in my experience, if the goal is merely to narrow a set of alternatives to about three, then the simple criteria matrix will work quite well.
In the third diamond, we are sort of flying blind. It’s been a while since we engaged with our potential customers. For this reason, we need to do some concept testing.
Let me illustrate why this is so important using a simple example. Imagine you are designing a new hot sauce. (Have you noticed by the way that I use a lot of food examples? That’s because I love food.)

You can think of any individual as having an ideal point, which is their true preference, say on two dimensions of saltiness and spiciness. When you interview them and observe them, they tell you how much salt and heat they like – maybe they tell you they like it really hot and not very salty. Of course, you as the designer don’t hear them perfectly well, and they are not perfectly accurate in describing what they like. There’s inevitably some imprecision.
Then, you go to the lab and create a product based on what you understand, and there is a further translation error in that execution. By the time, you’ve gone through three phases of interpretation, what you have cooked up and what the customer wants are likely not perfectly aligned. Correcting any such mismatch is not hard. You give them a prototype of your hot sauce and ask them what they think. Yikes, they say, that’s too hot and tastes sort of bland. Hopefully you land pretty close though, and can incrementally refine your solution to hit the target.
Of course, I bet very few of you are designing hot sauce, but the same logic applies to creating a service experience or a piece of software. What the customer tells you, how you understand it, and the fidelity of your engineering process will inevitably result in a mismatch between what the customer actually wants and what you have actually built. Concept testing lets us estimate whether or not you have a good match before you actually develop the product.
There are three common types of concept tests. The first is informal qualitative feedback based on a quite schematic description of the solution concept. For example, this is the very first prototype of the Apple iPod. It was made by Tony Fadell from cardboard covered with a laser printed graphic. I bet it didn’t take more than an hour to build.

You can’t have too much feedback on prototypes. Even showing potential users hand-drawn screens on paper – sometimes called “paper prototypes” – is super helpful in clarifying where the solution concept misses the mark.
In a second type of concept test, you set up a forced choice among a small set of concept alternatives, usually three.
For example, here is a forced choice concept test for three ice cream scoop concepts. The 3 options typically result from an internal concept selection process using a criteria matrix in which 10 original concepts are narrowed to 2 or 3.

You can use this kind of forced choice in lots of different design settings, not necessarily just for overall product concepts. Here’s another example of a forced-choice survey I used in testing three possible names for the environmental services company I co-founded. The name Terrapass was the clear winner and we went with that option.

In a third type of concept test, you ask potential consumers to indicate their purchase intent. Purchase intent is almost always measured using a five-box scale, from definitely would not purchase to definitely would purchase.
Here’s one of the ice cream scoop concepts as it would be used in a purchase-intent survey.

Purchase intent surveys are notoriously imprecise in predicting demand, but they are the best single predictor of consumer acceptance of a new product at the concept phase of development. I believe they are best used for relative comparison of several concepts. In my own research, I have found that you can test up to 50 concepts with a single respondent without too much fatigue, and that you only need a sample of about 15 representative consumers to get a reliable estimate of how potential customers will react to your product.
Of course the way you represent solution concepts to your audience influences their response. For example here’s the same purchase intent survey with the concept illustrated with a photo-realistic rendering. In this case the vibrance of the color is much more evident than with a black-and-white line drawing.

You will probably not have the details of your concept fully worked out when you engage in concept testing, so you will have to just do your best in representing the solution. In my opinion, consistency in the fidelity of the concept descriptions across different concepts is more important than the absolute level of quality of the representation of your concepts.
If you are very lucky, you will find that the concept you select (1) meets the customer needs, (2) is cost efficient, (3) evokes the “wow” response, and (4) exhibits beauty and elegance. More likely, significant iterative refinement remains as you put prototypes in front of potential customers and refine your solution. That’s normal. Hopefully, however, the results of a deliberate concept development process get you close to the target and a process of incremental improvement will allow you to hit the bullseye.
Karl T. Ulrich, Steven D. Eppinger, and Maria C. Yang. 2020. Product Design and Development. McGraw-Hill. New York.
Laura Kornish and Karl T. Ulrich. 2014. The Importance of the Raw Idea in Innovation: Testing the Sow’s Ear Hypothesis. J. Marketing Research.
Karan Girotra, Christian Terwiesch, and Karl T. Ulrich. 2010. Idea Generation and the Quality of the Best Idea. Management Science. Vol. 56, No. 4, pp. 591–605.
Tony Fadell. 2022. Build: An Unorthodox Guide to Making Things Worth Making. Harper Business.
You will keep a journal for the duration of this course. You will make entries in the week following each of the weekends in which we meet. The journal is for you. However, to maximize the learning across students in the course, you will post one reflection from your journal in the weekly discussion forum (for MGMT801 this is set up in Canvas) and then comment on one post of a classmate.
You will probably want to set up a Google drive folder (or equivalent cloud repository) for your work products for this course, including the journal.
The journal can be just free form text (e.g., a Google Doc). The journal is for you. You will submit a PDF of the entire thing at the end of the course just so we can give you credit for the work you are doing for the course. (You may redact any portion of the journal that you don’t want the TA and instructor to see.) You are completely unconstrained as to what is in the journal, but its contents will likely be primarily about you as a person in the context of entrepreneurship: How you feel about the possibility of being an entrepreneur. What roles you might want to assume in a new venture. What problem areas you’re excited about.
Extract one reflection from your journal and post it to the discussion. It probably makes sense to keep these posts to a paragraph or two, say 100-300 words. If you are stuck about a topic to reflect on, just pick the podcast, film, or book you enjoyed most recently and offer some reaction to it.
In addition to posting a reflection of your own, please respond to the post of a classmate. Your response can be to any post from any week.
Create an entry in your Entrepreneurship Journal entitled self assessment and put a date on it. You’ll probably be interested in returning to this entry periodically in the coming months and years.
Here are the prompts for the self assessment. (Note: some of these questions come from an article in the First Round Review about co-founders.) These are not structured as a survey scale or anything, but rather just questions that reveal your feelings about some of the key personal issues associated with being an entrepreneur. You do not need to answer all the questions. You should answer the ones that really force you to think.
Rate your competence in these areas (both as an individual contributor, and as a leader) on a scale of 1-10. Then rate your passion for each on that same scale.
Gloria Lin. First Round Review. The Process I Used to Find my Co-Founder
https://review.firstround.com/the-founder-dating-playbook-heres-the-process-i-used-to-find-my-co-founder

I’ve been a product designer my entire adult life. Here is one of the products I created, the Belle-V ice cream scoop. In full disclosure, I had a lot of help from a talented team. When people see the product they impute genius to the designer – wow, that’s amazing. How did you come up with that?

I’m using an example of a physical good for specificity, but I’ve experienced the same kind of reaction to digital products and services.
The reality is that I learned an effective process when I was in my 20s and I’ve applied that process repeatedly, sometimes weekly or even daily for 40 years. When you only observe the outcome, the results seem magical. But, the truth is that a fairly straightforward sequence of process steps can reliably lead you to a great result.
Design is just another word for the pull approach to innovation. All design processes are a sequence of steps that begin with some articulation of the “what” and result in some description of the “how” – the process moves from what to how.
Commercial phase-gate product development processes are just an elaboration of that basic idea, with lots of detail. My textbook on product design and development (Ulrich et al. 2020) is a comprehensive description of that detail. Most of you working in larger organizations probably use some sort of phase-gate process that is specific to your industry.
But, here I’m going to abstract a bit, and focus on the elemental design process – what is design at its very core. While design is the core problem solving approach within the product development process, design can be applied beyond product development. It’s almost a building block of being human – of dealing with life.
My goal is to describe the design process in a way that it can be used in myriad situations, from the creation of a new product from scratch, to the improvement of an existing product, and even for solving internal innovation challenges such as finding new ways to reduce waiting times in emergency departments.
To reiterate, the standard phase-gate product development process is a fully elaborated methodology that typically includes the roles of different functions within the organization. It emphasizes not only what to do in each phase, but the notion of a gate that must be cleared in order to proceed to the next phase. I am now going to boil that basic process down to its essence to give you a tool I call the triple-diamond model that can be used not just in zero-to-one product development, but also in almost any other problem solving situation.
To give credit where credit is due, the triple-diamond model is my extension and elaboration of the Double Diamond Model articulated by the UK-based Design Council, a non-profit organization with the mission of improving design practices.
The three diamonds correspond to three steps.
In practice, a fourth phase is usually important – implementing that concept in a way that the organization can actually deliver the solution. This involves writing the code, designing the parts, and planning for production.
The three diamonds each represent a cycle of divergent and convergent thinking. For each diamond, the designer explores alternatives, and then focuses.

The first diamond answers the question, “What is the job to be done?” It starts with a target customer and the gap or pain point as you have first sensed it, and it results in a carefully considered reframing of the design problem in terms of a job to be done. In fact, one of the critical elements of an effective design process is not even really problem solving so much as problem definition.
The second diamond begins with a job to be done and develops a comprehensive understanding of the customer needs, which are those aspects of a solution that could result in satisfaction and even delight if satisfied. The convergent portion of the second diamond identifies one or a few insights, which are essentially important customer needs that were previously not known.
The third diamond uses those customer insights to pull many possible solution concepts and then selects one or a few for further refinement and testing.
Let me show you how the three diamonds played out for the Belle-V scoop. I started with a vague sense that ice cream was really hard to scoop. In diamond 1, I focused on the at-home consumer of ice cream and came up with the job to be done “How might we better dispense bulk ice cream into individual portions?” In the second diamond, I observed people scooping ice cream and noticed that the wrist angle was quite awkward, even painful for some people. That insight allowed me to pull several different solution concepts, including the one that eventually was embodied in the product, a more or less conventional scoop, but with the scoop angled relative to the handle.


Of course, really, it’s diamonds all the way down. The triple diamond model focuses on the concept development process, but when the team proceeds to build the product based around a concept, it will almost certainly use additional cycles of divergent and convergent techniques in order to solve downstream problems, say for establishing a product architecture, or implementing specific components of the solution. For example, even after we had converged on the solution concept of an angled scoop, we did a huge amount of exploration to find the final form of the object. Another diamond focused on the detailed design of the shape of the scoop and handle. And for that matter, there was another diamond when we considered the surface finish of the scoop – divergent exploration of alternatives and then convergence on tri-valent chrome plating.

Some of you are thinking that this model seems pretty tidy for a very simple piece of hardware like an ice cream scoop, but may not apply to more complex goods and services, say to enterprise software or to a hotel experience. I have a couple of reactions to those reasonable thoughts.
First, as an aside, there’s a reason they call it HARD-ware – it’s hard. Even a simple object like an ice cream scoop presents a lot of complexity and challenges when it comes to actually getting it to the marketplace.
But, more substantively, for new, zero-to-one systems, software, or services, you must still devise an overarching solution concept. For example, consider LinkedIn – the top-level solution is essentially a user-created resume-like profile with the ability to establish a connection between two individuals, and then the ability to search 1st, 2nd, and 3rd order connections in the resulting professional network. Such an overarching concept could be developed with the triple diamond model.
For established systems, the triple diamond will be unlikely to be applied to the entire product or suite of products, but rather more likely to a feature within that more complex product. For example, once LinkedIn had become a successful product, the triple diamond model could still be applied, but to a new feature, say the creation of the follower feature, which allows individuals to follow another person and get updates that person publishes, but without requiring the individual to become a bi-lateral connection.
I happened to be on a holiday ski trip when I was writing this chapter. (I know, that doesn’t sound like that much of a holiday.) I kept thinking to myself, skiing is fun, but it’s a huge annoyance to actually get on the slopes. For most novice skiers, you have to procure skis, boots, poles, helmet, goggles, and warm clothing. Then, you have to put all that stuff on. Then, while fully dressed in really warm gear you have to walk awkwardly from transportation to a ski lift, sometimes navigating a flight of stairs. Then, you put on the skis. By then you are sweating and your goggles are fogged up. Next you wait in a line. Then you get on a windy and cold ski lift and become quite chilled. When you finally get to the top of the mountain, you stare at a map trying to figure out the best route down. Finally, you get to slide on the snow, which is actually quite fun. I’m an incurable innovator and so I found myself posing the question, “How might we improve the experience of getting skiers onto the slopes?”
If I were a trendy corporate consultant, I would call this a “design thinking” problem. But, I’m actually a bit of a crusty old designer. I’ve taught design for more than 30 years. So, I have to ask “what exactly is design thinking” and how is it any different from plain old design?
Well, first let’s first go back to the definition of innovation and design.
I define innovation as a new match between a solution and a need. Innovation can result from a push – starting with the solution and looking for a need. For example, what might we use the blockchain for? Or, it could start with the need and pull the solution, like I framed the skiing challenge. “How might we improve the skier experience?” Design is innovation anytime you are pulling a solution from a need.
So considering our definition, the short answer to what is design thinking is that it is design. Really. You apply the same process to creating a better ski experience as you do to creating a better ice cream scoop, or a better fitness app. In fact, the word design thinking annoys a lot of designers, because they are usually less interested in thinking about problems than in actually solving them.
Once I cool off a bit about the weird term “design thinking,” I realize there may be a gem of an idea in there, and that a bit of nuance may in fact be warranted.
A useful definition of design thinking might be that it is design of things we don’t normally think of as designed.
For example, here are some problems for which the design process could be used, resulting in solutions that would not normally be thought of as designed artifacts.
A lot of people talk about needing to apply more design thinking in business. I find myself wondering if the desire for design thinking is really just a reaction to the use of too many spreadsheets and PowerPoint presentations, disconnected from customers and from exploration of solution concepts. This reaction reflects a desire for a different and better culture of innovation.
I do think that good designers exhibit a few desirable elements of culture. Interestingly, most of these elements don’t need to really be confined to design. Here are five:
Despite my enthusiasm for all things design, I won’t argue it is universally the best approach to problem solving. For example, it would be a mistake to abandon elements of Six Sigma, Total Quality Management, the Toyota Production System, and data-based approaches. It would also be a bad idea to use a design process to find the volume of a geometric shape, a task better suited to an algorithm.
But, for a huge set of challenging problems, design is a great approach. It is fundamentally divergent and open-ended in its perspective on addressing user needs, and that’s useful whether you are designing a bridge, enterprise software, or an insurance claims process.
Karl T. Ulrich, Steven E. Eppinger, and Maria C. Yang. 2020. Product Design and Development. McGraw-Hill. New York.
Double Diamond Model. UK Design Council.
https://www.designcouncil.org.uk/our-work/skills-learning/tools-frameworks/framework-for-innovation-design-councils-evolved-double-diamond/

I’ve written a lot about opportunity identification in my books Product Design and Development, Innovation Tournaments, and The Innovation Tournament Handbook. The topic is also covered fairly extensively in the course OIDD 614 Innovation Management. Consider this chapter a quick summary of the big ideas in the context of identifying entrepreneurial opportunities.
On my weekly podcast I have interviewed about 500 founders. For about half of these founders, the opportunity found them; they did not go looking for an opportunity. For example, consider Flava Naturals, founded by Alan Frost. Here is how he describes the origin story.
“I told you we should eat more chocolate!” I looked up from my coffee and there was my wife holding out the New York Times, and looking very happy. She’d just read an article about a Columbia University study that linked chocolate to enhanced memory. (…) But I was a biotech exec accustomed to how the media could exaggerate the importance of findings in small studies. I love chocolate too, but was skeptical, to say the least. So I dug deeper. Sure enough I found dozens of placebo-controlled studies that demonstrated meaningful benefits of cocoa flavanols on brain, heart and skin function. There was a catch though, and a pretty big one. The best results seemed to require consumption of 500-1,000mg of cocoa flavanols a day — that’s 5-10 average dark chocolate bars! (…) So began my quest to develop a decadent chocolate with the naturally preserved flavanols proven so healthy. And a business was born.”
Alan Frost, Founder and CEO Flava Naturals
Another common pattern is that entrepreneurs experience a pain point themselves and then set out to create a solution to address their own needs, and hopefully those of a larger market. Tammy Sun founded Carrot fertility services when she found that her employer did not cover fertility benefits as part of her health insurance, and that there were no enterprise solutions for managing fertility services for employees. She then set out to found a company to meet that need.
A third pattern, probably least common, is that an individual or team seeks out an entrepreneurial opportunity but has no particular problem area in mind. For example, Alan Cook founded, grew, and sold a first business in the pet care space, an opportunity born out of frustration with conventional litter boxes for cats. After a brief sabbatical, he sought to start another company, but this time was agnostic about the specific problem area. With the help of members of his previous team, he generated and considered about one hundred distinct opportunities, from pre-packaged spices to reconfigurable furniture, before focusing on another pet care product, this time for dogs. He pursued that opportunity not because he experienced a need himself — Alan doesn’t even have pets — but rather because he felt his prior experience gave him an unfair advantage, always a good thing for an entrepreneur.
If you are motivated primarily by purpose, then the opportunity obviously matters a lot — after all you are setting out to do something specific in society. In that case, the entrepreneurial opportunity had better be aligned with that purpose. However if your goal is fun or financial return, does the selection of opportunity even matter very much? Put another way, is there not an opportunity to be financially successful or to have fun in pretty much any area of the economy? Sure, to some extent, you as an entrepreneur can probably find a viable opportunity almost anywhere you look. However, you will likely spend at least five years of your life pursuing a new venture. You might as well be quite deliberate about which opportunity you pursue. In my opinion, a good rule of thumb is that when considering taking the entrepreneurial leap, you should generate and evaluate at least ten different opportunities.

The process of identifying or generating a large set of opportunities and then selecting one or a few to pursue further is an innovation tournament. This tournament need not involve a large group of people. In fact, you can run that tournament by yourself.
There are two parts to an innovation tournament — (a) generating the initial candidates and (b) selecting the exceptional few. Let’s start with the end in mind and consider selection criteria. Then, I’ll give some guidelines for generating opportunities.
The motives and selection criteria for a new venture depend on you and your co-founders, if any. You might want to do something in Brazil or be involved in the skiing industry. Make a list. Be very specific about the desirable attributes of your future business. This list is usually quite personal. For instance, when I started MakerStock, one of my selection criteria for this new business — after having made and sold scooters for 20 years — was that our product would not be intrinsically dangerous, as are wheeled vehicles. In my old age I prefer not to think about customers getting injured with my product. You will have your own set of hopes, fears, and desires.
In addition to any idiosyncratic preferences you may feel, the following questions are always important:
After considering these questions and your personal preferences, explicitly articulate your selection criteria so you can use them to evaluate the opportunities you are considering.
Here is a template (as a Google sheet) to use in evaluating opportunities.
The process of generating opportunities usually plays out over weeks, months, or even years. Start a list. Accumulate ideas as they arise from whatever source. In addition to passive accumulation of ideas, you’ll benefit from focused, deliberate efforts to generate opportunities. Here are some guidelines, techniques, and heuristics for generating more and better ideas.
Push versus pull. Two distinct approaches to innovation are push and pull. With push, you start with a solution — say blockchain technology — and go looking for a market need. With pull, you start with a pain point experienced by consumers or businesses and you devise a solution. As a general rule you should take the pull approach. Identify a problem that potential customers have and then develop a solution that solves it better than existing options. The push approach can work on occasion, say when you start with a fundamental innovation in materials science that has the potential to be broadly useful. However, the push approach has proven to be much more risky than when you start with a pain point that is clear and obvious.
Second-best ideas. Learn from other entrepreneurs and ask them for ideas. Most successful entrepreneurs have dozens of ideas. They are working on their best idea, but you should ask them what is their second-best idea. Many will happily give you ideas and maybe even help you get started.
Imitate but better. find successful ventures in a field that interests you and improve on their offerings by adding new features or benefits, reducing costs or risks, targeting new segments or markets or creating a unique brand identity. Hundreds of interestiong new ventures are listed by AngelList, WeFunder, StartEngine. YCombinator. Crunchbase, and other organizations. Existing start-ups are a treasure trove of information on what has been tried, what is working, and what approaches have failed. You will not usually want to go head to head with an exact replica of an existing company for two reasons. First, differentiation is a good thing allowing multiple companies to flourish by serving different segments. Second, there’s no particular reason to believe a start-up a few months ahead of you has taken the best approach.
Scour social media. Use social media platforms like Reddit, Quora, and Twitter to find out what customers are talking about, what problems they have and what solutions they are looking for. Monitor trends, hashtags, influencers and feedback. Journalists, bloggers, and conference organizers are in the business of sensing. While their insights are available to everyone, not everyone is viewing those insights through an entrepreneurial lens.
Careful of gold rushes. On-line forums and media outlets will occasionally exhibit fad-like behavior and herding. For instance, as I write this, these forums are crowded with excitement about large language models, chat bots, and artificial intelligence. Unquestionably opportunities abound. However, you can not typically observe the number of rivals entering a new market, and some markets are gold rushes, with too much competition. You may be better served by a quieter niche.
Import from another geographic region. Innovations are often geographically isolated, particularly if introduced by smaller firms. You can sense opportunities by identifying outstanding products or services in a distant region and then considering how you might adapt them to a different place.Translating the innovation from one geographic region to another can be a source of innovation.
Consider lead user innovation. identify users who have a high need for your product or service and are ahead of the market in terms of innovation. Observe how they use your product or service and what modifications they make to it. Incorporate their feedback and suggestions into your product development.Firms have ample incentive to innovate. Innovation, after all, can result in new sources of cash. But lead users and independent inventors may have even greater incentives. Lead users are people or firms that have advanced needs for products or services that are not being met by other companies. They must either tolerate their unmet needs or innovate themselves to address them.
Poke around universities. Major research universities are wellsprings of opportunities and have produced such successes as Google (Stanford), Genzyme (MIT) and many others. Some of the opportunities spring from faculty-led research, particularly in the life sciences. Others are created by the legions of bright young students who enroll to chart new directions in their lives and careers.
Here are several interviews I’ve done with founders that have particularly interesting origin stories. Sample the ones that interest you. Most interviews are about 25 minutes long and the origin story is usually in the first third of the interview.
Coravin (Greg Lambrect) – wine dispensing
Eat Just (Josh Tetrick) – alternative protein
Rebellyous Foods (Christie Legally) – alternative protein
Frutero (Mike Weber and Vedant Saboo) – ice cream
Flava Naturals (Alan Frost) – nutraceuticals
Carrot (Tammy Sun) – fertility services
The Infatuation (Chris Stang and Andrew Steinthal) – restaurant guide
Ulrich, Eppinger, Yang. Product Design and Development. Chapter “Opportunity Identification.” 2020. McGraw-Hill.
Terwiesch and Ulrich. Innovation Tournaments. Chapter Opportunity Identification. Harvard Business Press. 2009.
Terwiesch and Ulrich. The Innovation Tournament Handbook. 2023. Wharton School Publishing.

