I recently read the book “Why we sleep” by Matthew Walker. It really scared me, and I decided that better sleep should be a priority in my life. Being an analytical guy, I first wondered how good my sleep is currently, and how I could monitor the quality and quantity of my sleep. After considering and trying several approaches, I eventually adopted the Oura ring and its associated app to address this challenge. In fact I’m wearing it right now.
The Oura ring is a product. More generally, products are solutions for doing a job, delivered by a producer to multiple customers.
Probably some of you are involved with producing physical goods like the Oura ring. The term product is sometimes used narrowly to refer to physical artifacts, but I will use the term to refer not just to tangible goods, but also to software, and to services.
Here are some more examples that fall within my definition of product, all related to health and wellness, just to bring a bit of focus to the examples. Each of these products contains a solution for doing a different job. In fact, as is common in practice, I’ll even sometimes refer to products as “solutions.”
The Strava app supports fitness by measuring and analyzing running, cycling, and other activities.
SoulCycle Studios provide fun and engaging exercise while delivering a community experience.
The pharmaceutical Zocor lowers blood cholesterol levels, thus reducing the risk of heart disease.
The patient medical record system EPIC captures health information for individuals in a way that is secure, durable, and accessible across providers.
The food product Flavanaturals provides a tasty chocolate beverage that delivers flavonoids shown to improve cognitive function.
The Hamilton Medical ventilator is used by hospitals to support breathing in patients suffering from acute respiratory illness.
Many if not most products combine some tangible goods with services or software. The Oura Ring is both an app and a physical device, and physical goods like exercise equipment and medical devices typically contain a huge amount of embedded software, and likely some ancillary services.
For completeness, let’s get some pesky technicalities out of the way.
Frankly, I could use a burnt stick and a flat rock to record a time series of subjective judgments of my sleep quality. But, that would not be a product. Products are solutions created by producers and delivered to customers.
An artifact that will be created only once, say a war memorial, is probably not best considered a product in and of itself, but the service of designing and constructing monuments could be a product, because the supplier, say an architecture firm or a sculptor, will likely do it repeatedly.
In most settings, a producer delivers a solution to a consumer in a commercial transaction. Most of the time I’ll use the words customer or user to refer to the consumer, but sometimes there are multiple stakeholders and the definition of the consumer is a bit murky.
In the simple case, consumers are individuals who both purchase products and use those products. I decide what shampoo to buy and I use it. But in other cases one party makes the purchasing decision and someone else uses the product. A hotel chain may buy shampoo for its rooms, but the hotel guest uses it. And, in this case, the customer is a business not an individual, and the customer is not identical with the user.
I like the term “doing a job” to indicate what products do, but I’m going to use several words pretty much synonymously: Job to be done, problem, gap, pain point, and even the more clinical term demand, which you probably remember from an economics course. Demand is just jobs to be done that we as consumers can’t do, or don’t want to do for ourselves.
Dozens of other categorizations of products are possible — consumables, durables, consumer packaged goods, fast moving consumer goods, and an alphabet soup of associated acronyms – CPG, FMCG, B2B, B2C. All of these are just further specification of types of solutions used in different settings to do different jobs.
Finally, there’s a special kind of product, called a platform or a two-sided market, in which the job to be done is to bring together buyers and sellers. For example, the web-based product ZocDoc matches individuals with physicians for acute medical needs. In these settings, the platform provider has two very different types of customers, the two sides of the market, the buyers (in this case patients) and the sellers (in this case physicians).
What is Product Management
Here is the LinkedIn profile of a former student, Effie Wang. Effie served as the head of product for the dating app, Bumble, and she’s been a product manager at Amazon, ZocDoc, and GrubHub. What exactly is product management and what do Effie and those like her actually do?
Put very simply, companies deliver solutions to customers who have a job to do. Product managers stand at the interface between the customer and the resources that create and deliver products.
Product management in the broadest sense is the planning, creation, and improvement of products. These functions exist in all companies that deliver products to customers, so product management must also exist, whether or not the functions are assigned to someone with the job title Product Manager.
Some descriptions of product managers that I like include:
Creator or guardian of the product vision.
Interpreter and protector of the customer experience.
Guide for the technical resources to create or improve the product.
Prioritizer of the feature and improvement road map.
My favorite less formal description of product management, coined by my former student and co-founder of Gridium, Adam Stein is, “making sure that not even one hour of an engineer’s time is wasted.”
The role of product management varies quite a bit over the lifecycle of a product. Let me explain. I like to think of the product lifecycle as having four phases: Sense, Solve, Scale, and Sustain – The Four S’s.
Sensing is recognizing an opportunity for a new product, usually the result of some kind of disequilibrium in the market or in the technological landscape.
Solving is creating a product to respond to the opportunity, and typically launching the first version.
Scaling is the improvement of the initial product to deliver an excellent solution tailored to the bulk of the market.
Sustaining is the refinement of the product over its life, advancing both cost and product performance. While the first two phases, sense and solve, typically play out over months or a year or two, and the scaling phase another few years, the sustaining phase can last decades.
I find it useful to think of three types of product managers: innovators, builders, and tuners, which we can map onto the product life cycle. Innovators recognize and develop new opportunities. Builders start with a target and lead developers to create a great product. Tuners optimize the success of the product over its lifecycle. The scaling phase is a less clearly demarcated zone, and product managers in this phase can be thought of as builders or tuners, or a hybrid of the two.
Sensing new product opportunities, the role of innovator, may be performed by someone with the job title of product manager, or by a chief product officer, but that role could also be played by a founder of a start-up, by a business unit manager, or by an advanced development, or strategic planning group.
During the solving and early scaling phases, a dedicated product manager almost always leads the development effort. This is sometimes called “zero to one” product management, creating a new product from a clean slate. In technology-intensive hardware companies, this role may not be called product manager, but rather “heavyweight project manager” or “development team leader” or “program manager” but the role is that of the builder product manager.
In the sustaining phase of the product life cycle, dedicated product managers are typically only found in highly dynamic product environments. Dynamic environments are those for which the product changes a lot, say at least quarterly.
For instance, the fitness app Strava has dedicated product managers, but the Irwin hammer does not.
My Strava app is now version 232.0.1 updated two days ago, and Strava releases a new version (230, 231, 232, etc.) every week. The Strava app is a highly dynamic product – it changes a lot. Why is that? There are two reasons. First, it’s a software product which exhibits a high degree of modularity, so features can be updated easily and even pushed to the user on a regular basis. Second, the app operates in a highly dynamic competitive environment, and in a domain in which the enabling technologies are changing rapidly.
The Irwin hammer on the other hand has not been updated very recently at all. It’s pretty much the same as the Stanley hammer I worked on as a product designer in 1990 (Stanley and Irwin are brands owned by the same company), and really it’s not that different from this Craftsman hammer my father gave me when I was 15. It’s not that hammers never change. They do, and when they do, the function of product management must be performed.
For example, If there’s an emerging trend for tools to be produced in bright fluorescent colors to make them easy to find, then a project will likely be kicked off to do a redesign of the hammer. But, that decision and the planning and coordination of the effort, will likely be the result of a cross-functional discussion among the business unit manager, the marketing manager, and the engineering manager. There is not a dedicated product manager for the hammer the way there is for the Strava app.
Some people define the job of product manager as the CEO of the product. Well, that’s not quite right. Rarely does the product manager or PM have responsibility for the profit and loss of the product — that falls to the business unit manager or CEO of the business. Furthermore, while the PM may be responsible for prioritizing features, he or she rarely has direct authority over technical resources, that’s usually the responsibility of an engineering manager.
In describing the role of the PM, it’s probably better to consider specific decisions. I’ll use the RACI (“RACY”) framework to do so. Most of you have probably seen the RACI framework, but to remind you, each stakeholder in a key decision can be thought of having one of four roles:
R is for RESPONSIBLE — The responsible person actually does the work supporting a decision and delivers the outcome. More than one person can be responsible.
A is for ACCOUNTABLE — Only one person can be accountable and that person owns the results. He or she approves decisions, signs off on actions, has veto power, and can make go/no-go decisions.
C is for CONSULTED — Some stakeholders are consulted. They provide information, perspectives, resources, and support as needed.
I is for INFORMED — Finally, some stakeholders are merely informed of decisions. They are kept up to date on progress and results, but not necessarily consulted prior to decisions being made.
Now let’s consider some key decisions and which roles key stakeholders assume. I’ll show typical roles for the product manager, product marketing manager, engineering manager, business manager, UI/UX designers, and Sales manager in the context of a digital product. There are of course many other decisions and several other stakeholders, but these are the most commonly associated with product management in information-technology companies. The roles are not identical for every organization, which is one reason you may benefit from discussing these roles explicitly within your own organization, and gaining a shared understanding of who does what.
I won’t drag you through every cell of the table, but if we focus on the first column, the role of the Product Manager, we see that the decisions for which the PM is responsible and accountable are the product vision, product concept, and product roadmap, but that in this context the PM is consulted on branding, go to market strategy, pricing, growth, and partnerships.
Can Product or Product Management be a Source of Sustained Competitive Advantage?
First, I need to be clear that not all things that are important can be sources of sustained competitive advantage, resources I call alpha assets. For example, an excellent sales process is very important for enterprise software companies. That doesn’t imply that an enterprise software company can rely on its sales process as a significant source of sustained competitive advantage. It’s more that if you fail to do sales well, you are unlikely to be successful in enterprise software. We could say the same thing about operational competence for a restaurant, or accurate and timely finance and accounting processes in a bank. None of these things are likely to be sources of sustained advantage, yet they all need to be done competently to ensure success. In the same way, good products and effective product management are critically important for all companies, even if not alpha assets for all companies.
But, product can be an alpha asset in some settings. These two settings are (a) zero-to-one new products and (b) domains with very strong intellectual property barriers.
Let’s consider the zero-to-one setting. Peter Thiel famously wrote in his book Zero to One “as a good rule of thumb, proprietary technology must be at least 10 times better than its closest substitute in some important dimension to lead to a real monopolistic advantage.” I don’t fully agree with the statement, but I do agree that when there is some disequilibrium in technology or in the market, then an organization has an opportunity to move with speed and agility to take advantage of that disequilibrium and to create a product that is dramatically better than the pre-existing alternatives. At the dawn of the covid pandemic of 2020, the videoconferencing company Zoom was in the market with a product that just worked. It didn’t require registration. It didn’t require a download. It didn’t require any special gear. It just worked. Despite the fact that there were dozens of other solutions in the market at the time, including BlueJeans, Skype for Business, Google Hangouts, and WebEx, Zoom was able to seize the market and gain significant share. This was almost entirely because Zoom had a better product. Better product can be an alpha asset for a finite time period after some type of disequilibrium. This finite period of product superiority is a way of kick starting the other flywheels in an organization. But, the organization must use this precious window wisely in order to oversee the acceleration of the other flywheels for sustained advantage. Indeed, Zoom took advantage of its initial product superiority and prospered. But, predictably Microsoft was quick to follow with an enterprise product, Teams, that was at parity on many features and superior in others. Zoom remains a key player, but its product per se is no longer its primary alpha asset.
Now let’s consider intellectual property barriers. Some domains have very strong legal intellectual property barriers, which allow product itself to be an alpha asset. For example, during the same pandemic period, the companies BioNTech, Pfizer, and Moderna all created mRNA vaccines that enjoy almost impenetrable intellectual property protection. For these companies, the product itself is an alpha asset. It enhances performance and is almost impossible for a rival to acquire.
Not all intellectual property needs to be protected by laws to be a barrier. For instance, the product of semiconductor company TSMC is a fabrication service it offers to designers of proprietary chips like NVIDIA. While TSMC has a lot of patents, its primary source of intellectual property barriers is the accumulated know-how and trade secrets embedded within its semiconductor fabrication process. Some people believe that what TSMC does is the hardest single task in the world. No one else comes close to being able to do it. In this case, the intellectual property associated with the product itself is an alpha asset.
In some settings, the product itself is only incidentally the alpha asset. In very dynamic markets – those for which some combination of enabling technologies, competitive actions, or customer behavior are changing very quickly – the organizational capability of product management can itself be an alpha asset. For example, consider the fitness app Strava. Strava does weekly product releases, which include incremental improvements and less frequently substantial product changes. Any particular version of the Strava app could likely be easily replicated by a team of developers and so the product per se is not much of an alpha asset. However, the system that Strava employs to engage its users, understand opportunities for improvement, and prioritize the changes in its product roadmap, benefits from data and experience with millions of users and a refined organizational process of product management. This organizational capability is an example of the fifth flywheel and a compelling alpha asset.
Belle-V Kitchen is a consumer goods company I founded with several friends to bring to market high performing but beautiful kitchen tools. Although the products we make and sell are outstanding, at least in our opinions, the company has never been a wild commercial success. One of the problems with the business is that the unit economics and financial model are only marginally favorable. It’s sort of our own fault. From the outset, our analysis of the unit economics and financial model did in fact exhibit vulnerabilities, or at least reveal a pretty narrow path to success. This chapter may help you be disciplined enough to avoid a similar plight.
Every single business incurs some on-going costs associated with merely existing. For instance, virtually every business pays an annual fee to a government entity and pays something to maintain a postal address. Most businesses incur costs for insurance, telecommunications services, and accounting software. Many businesses rent facilities, pay utility bills, and hire administrative employees. All of these costs are called general and administrative costs or G&A under generally accepted accounting practices (GAAP). With a few tiny exceptions, all businesses also incur costs to generate demand for their solutions. I call these sales, marketing, and advertising costs or SMA. Technology-based businesses may also have significant research and development or R&D costs. Put together these costs are the on-going costs of operating the business, are incurred over time, and do not change immediately in direct proportion to the company’s revenue.
In order to achieve long-term financial sustainability, a company’s gross profit has to exceed the on-going costs of operating the business. Put simply, gross profit is the revenue customers pay the company minus the variable cost of delivering the solution. Here’s a simple example. If a bubble tea shop costs USD 120,000 per year to operate, then it must generate at least USD 120,000 in gross profit per year to remain in business indefinitely. If customers pay USD 6.00 for each serving of bubble tea and delivering each additional serving of bubble tea, including materials and labor, costs USD 2.00, then the shop must deliver 30,000 servings of bubble tea each year to sustain itself, or break even. That works out to an average of 577 servings every week.
Unit Economics
For a bubble tea shop, the selling price of USD 6.00 and the cost of delivering a serving of bubble tea of USD 2.00 are called the unit economics. Unit economics are the revenues and costs of a business measured on a per-unit basis, where a unit can be any quantifiable element that brings value to the business, such as a single quantity of a physical good sold, a single consulting engagement, or a single customer relationship. Analyzing the economics of a business at the level of a single unit informs managerial decisions about pricing and about the inputs to the solution and their costs. The unit economics also dictate the minimum number of units that the company must serve or deliver in order to break even. If the unit economics are not favorable, the overall economics of the business, which include its operating costs, can not be favorable.
Analyzing unit economics first requires selecting the unit of analysis. This selection depends on the characteristics of the business. Businesses vary on innumerable dimensions, including cost structure, distribution channels, frequency of transactions with customers, and the business’ role in a market ecosystem. These differences are reflected in the financial models of the businesses. Some require huge investments in research and development, but then enjoy high gross margins once the product is launched. Others operate on slim margins, but don’t require much selling expense once a customer is acquired. Still others offer an all-you-can-eat solution for a subscription fee. While no two businesses are identical, four different types of businesses emerge frequently enough and have distinct enough financial models that they warrant separate treatment:
In this chapter, I describe these four types of businesses, the focal unit most appropriate for that type of business, and a common financial model associated with that type. Your business may fall between these categories, but almost certainly one of them will be pretty close, and will give you a template to start from.
Along the way I’ll introduce some more terms and concepts that are more generally useful, including these:
Gross margin
Marginal cost
Cost of goods
Target costing
Minimum viable scale
Customer lifetime value
Customer acquisition cost
Recurring revenue
Gross merchandise value
Take rate
Because I treat four distinct categories of businesses, this chapter is long. Life is short, so you may benefit from identifying which category is most relevant to your venture, and then focusing on that section below. However, I do introduce key terms and definitions as I go and don’t repeat them for each example, so if you are new to managerial accounting, you may benefit from reading the whole chapter.
Belle-V Kitchen is an example of a classic make-and-sell business. Such businesses simply produce a good and sell it to customers in a single transaction. The business may deliver a physical product like a bottle opener or a service like a restaurant meal. I write make-and-sell business, but some businesses are actually sell-and-make, in which the good is produced according to the specifics of a customer order, as with say Abodu Homes, a company providing prefabricated structures for use as accessory dwelling units in the United States. Regardless of sequence, these classic businesses follow a similar template.
The focal unit for a classic make-and-sell business is each instance of the product itself — the kitchen implement, the housing structure, a cup of bubble tea, or an excursion with a tour guide. In all cases, a classic make-and-sell business incurs significant marginal costs to deliver a unit of its solution to its customers. Let’s now drill down on the unit economics of classic make-and-sell businesses using the example of Belle-V Kitchen and starting with an explanation of the concept of marginal costs.
Cost, Marginal Cost, and Cost of Goods
The word cost is often shorthand for the accounting term cost of goods sold or COGS. These are the costs directly attributable to delivering the solution to the customer. In the case of Belle-V Kitchen, these are the costs associated with the manufacturing of the opener itself, as well as the costs of getting it to the point of distribution, fulfilling the customer’s order, and shipping the opener to the customer.
For classic make-and-sell businesses, costs are expressed on a per unit basis, but that unit cost typically assumes some batch quantity in manufacturing. For instance, Belle-V obtains openers from a factory in China that makes high-quality stainless steel kitchen implements for many premium brands globally. When ordered in quantities of 10,000 pieces per order, Belle-V can buy these openers from the factory for about USD 7.00 per unit.
Note that this factory price would be higher for an order of 3,000 pieces and lower for an order of 100,000 pieces. In analyzing unit costs, the entrepreneur makes an assumption about the approximate quantity that will be produced, often quantities that can reasonably be achieved in the medium time horizon, say after a year or so of operation.
That USD 7.00 factory price is just a portion of the COGS however. Here is the full list of elements that make up COGS, all expressed as USD per unit, assuming an order quantity of 10,000 pieces.
manufacturing cost 7.00
freight from factory to US warehouse 0.30
duties paid to the US government 0.28
labor to unload and store the inbound freight 0.02
materials and labor to process, pack, and ship openers to a retailer (assuming a bulk carton of 36 pieces) 0.14
scrap and warranty replacements (averaged over time) 0.10
Total Cost 7.84 (USD/unit)
Each additional unit sold incurs an average cost of about USD 7.84. This is called the marginal cost of the delivering the solution, because it is the additional cost “at the margin” of delivering one more unit.
Again note that marginal cost analysis implicitly requires an assumption about the quantities that will be ordered or produced. The business’ marginal cost might be a bit lower if it could order in much higher volumes in the longer term, and would be higher if it had to make openers just a few at a time, say while testing the market. For planning purposes, a financial model should explicitly state the embodied assumptions about order quantities, and analyze several scenarios, say for the modest expected quantities in year 2 and for larger expected quantities in the longer term, say in year 5.
Target Costing
For classic make-and-sell businesses, an important analysis is called target costing, which forces the manager or entrepreneur to bring anticipated selling price and estimated unit cost into coherence. This is the part we didn’t do so well with Belle-V Kitchen.
We planned for the Belle-V opener to be sold as a luxury gift and we originally expected it to be priced at USD 50 per unit in the store. We set this price by looking at other items in the store intended as nice gifts and by thinking about what the buyer’s alternatives for other nice gift items might be. We considered price points from USD 19 to USD 59. Setting your prices should be a deliberate exercise, and in established companies is usually coordinated among the business manager, marketing and sales managers, and the product manager. I’m not sure we were right in setting our price at USD 50. That’s a lot for a bottle opener, even a really nice one. In later years, we adopted a direct-to-consumer model at a lower price point. More on that below.
A target costing analysis works back from the price the product would sell for in the store to what the cost must be at the factory in order for the economic system to work for everyone.
Let’s first consider a typical retailing model, in which Belle-V sells on a wholesale basis to a store, that in turn sells to an individual consumer.
We anticipated a retail price of USD 50. However, the consumer isn’t giving us, the brand owner, 50 dollars. Instead, they’re paying the retail store 50 dollars. In order for the retail store to be in business, the retailer has to buy the product from us for quite a bit less than 50 dollars. In the Belle-V case, in which retailers are mostly specialty gift boutiques like museum stores, the retailer’s gross margin is typically 50 percent. That is, the retailer sells the opener to the consumer for USD 50, but pays us just USD 25. So, the retailer makes USD 25, or 50 percent of the selling price.
Now we have to work back from the price we get from the retailer to what our target cost would be. To do that we need to think about what we as the brand owner need for gross margin. Let’s assume for now that our target gross margin is 40 percent. That is, on average we want the gross profit on each unit to be about 40 percent of the revenue we get from a sale of that unit.
Since we get USD 25 in revenue for each unit, the price the retailer pays us, we need to pay no more than 60 percent of that figure for the goods, or USD 15, in order to leave 40 percent gross margin, or USD 10.
Fifteen dollars is the maximum cost of goods we can pay in order for us and our retailer to earn reasonable margins and to sell the product to the consumer for USD 50. This arithmetic simply works backwards from the selling price to the consumer through the distribution channel, and accounting for the required margins at each step, in order to arrive at the maximum cost we could pay for each unit and still remain in business.
Incidentally, for consumer goods sold through specialty retailers there is a short-hand “rule of 4” that the end consumer price is four times the cost to get the product into the original brand owner’s possession. It’s a pretty good quick way to check the feasibility of making and selling a consumer good. A rule of 4 corresponds to two parties in a supply chain each earning 50 percent gross margin.
I want to now drill down on two additional points. One is the arithmetic to calculate gross margin. The second is where those gross margins come from — and what values are reasonable in practice.
Gross Margin
Gross margin is defined as the price minus the cost, divided by the price. This is always taken from the perspective of the entity that’s selling the product. So for instance if USD 50 is the price the museum store offers to the customer, and they pay us USD 25, then their gross margin would be 50 percent. That is, 50 – 25 (which is 25) divided by 50. And if instead they paid us USD 28, then their gross margin would be 44 percent – that is, 50 – 28 (which is 22) divided by 50.
Note that gross margin is not the same as mark up. Mark up is defined as the price minus the cost, divided by the cost. So, if the retailer buys the opener from us for USD 25 and sells it for USD 50, then the mark up is 50-25 (which is 25) divided by the cost (which is 25) or 100 percent. Some industries use mark up and some use gross margin. Of course these two metrics are related arithmetically as follows: gross-margin = mark-up / (1+ mark-up), so you can convert from one to the other. I find it easier to always start with price and cost and then calculate gross margin or mark up from those two values as needed. From here on, we’ll use gross margin, as it is the more common term and because it directly drives an important metric in a company’s financial statements, gross profit.
What determines a reasonable gross margin for a retailer? First of all, volume. All else equal, the lower the volume of the retailer, the higher the margin the retailer requires in order to be able to stay in business. Just consider the difference between a grocery store that moves hundreds of thousands of dollars in volume every week compared to a jewelry store that might only sell one or two items a day. The jewelry store will require higher gross margin.
Second, the higher the price, the lower the gross margin, all else equal. Consider the difference between selling a new automobile and selling a hammer. The automobile will have a lower gross margin percentage.
The third factor is differentiation. All else equal, if your product is so special that you’re the only source of supply, then your gross margin will be higher than for a product with a lot of competitive alternatives.
The final factor is the costs that are required for the retailer to sell your product. Characteristics that increase the costs for a retailer selling your product are seasonality, service requirements, and the intensity of the sales process. The higher these costs, the higher the required gross margin for the retailer.
Now to put this all together just consider the difference between construction materials and luxury cosmetics
Construction materials exhibit relatively low differentiation with relatively stable demand at relatively high price points in high volumes. Thus, they are going to be sold at quite low margins, maybe only 10 or 15 percent. Luxury cosmetics are the opposite on all of those dimensions, and thus retailers of those goods will likely expect margins of greater than 60 percent.
To give you a sense of a typical range, retailers of most consumer goods require margins of between 35 and 55 percent, but extreme examples, say building materials and luxury cosmetics may be outside of this range.
Now let’s turn to the question of what your target gross margin should be as the manufacturer or the brand owner.
A very similar set of factors drives the typical gross margin requirements for manufacturers. Higher gross margins correspond to some combination of high R&D costs, high selling expenses, high levels of differentiation, lower volumes, and high seasonality.
Manufacturers of consumer goods would expect to operate with gross margins between about 30 and 50 percent, but at the high end a brand owner for fashion apparel might have a gross margin of 75 percent or higher. And at the other extreme, auto makers might operate with gross margins of under 20 percent.
One good technique for estimating margin requirements is to study the income statements of public companies selling products similar to yours. These financial statements will give you their average gross margin, a useful benchmark.
Selling Direct
Often when the target cost analysis reveals either margins that are too tight, prices that are too high, or required manufacturing costs that are too low, the entrepreneur thinks, “No problem. We’ll cut out the intermediary and sell directly to consumers!” This is rarely a solution to lousy unit economics. That’s because in direct-to-consumer models, you can’t typically assume the other parameters for the business remain the same. There are three reasons selling direct is almost never a cure for marginal costs of production that are too high.
First, your unit cost will increase. For Belle-V Kitchen, here is how the unit cost changes assuming we sell direct to the consumer in individual quantities, and that we pay for the outbound freight associated with “free shipping.” Recall that our unit cost when selling to retailers is USD 7.84.
manufacturing cost 7.00
freight from factory to US warehouse 0.30
duties paid to the US government 0.28
labor to unload and store the inbound freight 0.02
labor to process, pack, and ship a customer order (usually just one opener) 3.00
carton, packing material, tape, and label (single unit) 0.40
outbound freight paid to ship the opener to the end customer (single unit) 6.50
scrap and warranty replacements (averaged over time) 0.10
Total Cost 17.60 (USD/unit)
Second, your volumes will likely decrease. The whole point of using a retailer for distribution is to make your product easily available where your customers expect to find it, and where they can see and touch the product. A bottle opener sold in the “big box store” Target will, all else equal, sell vastly more units than one sold only on a website of a start-up company. With lower volumes, your marginal cost of production may increase, which must be reflected in your analysis of the unit economics.
Third, you may incur higher selling expenses. You have to find and acquire the customer when you sell directly to consumers. For e-commerce retailers this often means paid advertising, which can be very expensive. Acquiring customers for consumer goods can cost USD 50 per customer or more depending on the level of competition for keywords used in advertising.
If we wanted to sell the opener directly to consumers for USD 29 and maintain a gross margin of say 60 percent to support our higher selling expenses, then our unit cost must be less than (1-0.60) x 29.00 = USD 11.60. That’s clearly not going to work, as our marginal cost of delivering an opener is USD 17.60. At that unit cost and a selling price of USD 29.00, our gross margin would be only 39 percent. That’s not enough for a direct-to-consumer housewares business. A price of USD 39.00 is closer to feasible, leaving a gross margin of 55 percent, still not wonderful. The reality is that Belle-V Kitchen couldn’t quite get the unit economics to work for this opener when selling direct to consumers.
Minimum Viable Scale
Most pro forma financial analyses for start-up businesses are fantastic fables, representing a big success scenario. It’s good to have hopes and dreams and to envision paradise. However, I believe you also benefit substantially from knowing what the business looks like at its minimum viable scale. By minimum viable scale, I mean the number of units sold or customers served per time period such that you can achieve positive cash flow. At least two factors tend to dictate this scale.
First, what is the minimum required level of staffing and business services that you need to operate. For instance, you might need a minimum of a general manager (perhaps you), a customer service representative, a sales and marketing person, and a production or fulfillment staffer or two. You might need a physical location and to pay some rent. You will likely need an internet connection, some insurance, utilities, and bookkeeping services. Add all that up and that’s the minimum on-going operating costs of your business. Now, what is the number of units sold or customers served per time period (e.g., month or year) to break even relative to those operating costs. That is one indicator of the minimum viable scale.
Second, are there some natural minimum batch sizes and order frequencies that are required to sustain the business. For instance, for Belle-V kitchen, we need to buy a minimum of 3000 pieces per order from the factory and we need to place an order at least annually to sustain that factory relationship. Therefore, it’s not really possible to imagine the business surviving if it can’t sell at least 3000 units per year.
Put those two factors together to estimate what the business would need to look like to remain in operation and to sustain positive cash flow. Every business is unique and every entrepreneur has a different threshold for what is truly minimally viable. Still, by considering these two factors you can estimate a minimum viable scale for your situation. The resulting scale is of course not your goal. It’s instead a realistic assessment of what level of success you must achieve in order to live to fight another day. I like to think about the entrepreneurial journey as a long ocean swim. You’re setting out from the beach on a sunny day. You can see what you believe to be a beautiful tropical island off in the distance. That’s your goal. But, what happens if the wind picks up, or the water gets choppy, or your leg cramps? Is there a smaller island where you can rest and recover? How far out is it? That’s your minimum viable scale.
Putting Unit Economics Together in a Financial Model for Classic Make-and-Sell Businesses
Here’s a process for understanding your unit economics and creating a financial model for a classic make-and-sell business.
Decide on your distribution and channel configuration (e.g., direct to consumer vs. selling through retailers).
Set a target price to the end customer based on the competitive situation and the value of your solution to the customer.
Estimate your target cost by assuming gross margins for you and for your distribution channel. For a good first estimate, base these gross margins on typical margins for similar companies in your industry.
Check your costs to be sure your marginal cost of production is well below your target cost estimate.
Estimate the on-going costs of operating your business, and then use your gross-margin estimate to do a break-even calculation for the number of units you need to sell per time period to sustain your business.
Prepare a pro-forma income statement for what the business can look like if you are successful. Also create a second pro forma income statement for the minimum viable scale. These two financial models represent your goal as well as your fall back position should things go much worse than planned.
2. Low-Marginal-Cost Services (e.g. Quickbooks)
Many important businesses deliver services with very low marginal cost, sometimes close to zero. For example, a business that sells templates for legal documents may deliver its solution as a digital download. The marginal cost of delivering ten documents per day or ten thousand documents per day is essentially the same, and essentially zero.
One warning. Be careful about assuming your cost of goods is zero for all digital goods. For instance, content businesses like Netflix deliver a digital good, but they pay the original content creator for that content, often in proportion to the number of times it is delivered. In such cases, the marginal cost of delivering a solution is significant. In a second example, many AI-based businesses require expensive cloud computing resources each time a customer makes a query. These are real marginal costs of production.
Two approaches to analyzing unit economics for low-marginal-cost businesses are common. First, if the solution will be used infrequently by the target customer, then the unit of analysis may be the product itself, say the delivery of a single document template. In that case, the unit of analysis is a single transaction and the gross margin is nearly 100 percent. Breakeven calculations can be done exactly as with make-and-sell products, considering how many transactions must be completed to generate enough gross profit to cover the on-going operating costs of the business. The only difference from make-and-sell businesses is that the gross margin per unit is essentially the sales price per unit, as there are no significant marginal costs of production.
Second, and perhaps more typically, products with low marginal costs are priced on a subscription basis per customer, or possibly per user when there are multiple users per customer. This is especially true for products that are consumed intermittently but repeatedly over time. Examples of such products include Zoom, Adobe Acrobat, and Quickbooks. They are all priced on an “all you can eat” subscription basis. Most of these products are delivered over the internet as software as a service or SaaS. For simplicity I’m going to focus on SaaS products in further elaboration. For SaaS products, the unit of analysis is most commonly the customer, not each use of the product.
Customer Lifetime Value (LTV or CLV)
The most important metric in SaaS unit economics is customer lifetime value (LTV, or sometimes CLV or even CLTV). LTV in turn is driven by just two factors: churn and revenue per unit time.
Even a very sticky product like Quickbooks experiences some loss of customers over time. This loss is called churn, and is expressed as a percentage of the customer base that is lost in a given time period. Put another way, over a given period of time — say one year — what is the probability that a customer will cancel their subscription for use of the product? Some products, like Quickbooks, have very low churn, say less than 10 percent annually. Others, like video streaming service Disney+ have very high churn, perhaps 10 percent each month. (Admit it, you’ve subscribed just to watch a new series, only to quickly cancel when done.)
Churn can be thought of empirically and retrospectively — what fraction of our customers cancelled subscriptions last month, or it can be thought of as a probability about the future — what is the chance that a customer cancels in the coming month. Either way, churn is expressed as a percentage per unit time, say 15 percent per year, or 2 percent per month, using whichever time period best matches the pace of the business. Enterprise SaaS companies tend to use years and consumer SaaS companies tend to use months.
Note that the average duration of a customer relationship is simply 1/churn. So, for instance if your churn is 10 percent per month, then the average customer is with you for 1/0.10 = 10 months.
Revenue per unit time is just the average subscription fee your customer pays, say USD 15 per month. Armed with churn and average revenue per unit time, we can calculate LTV. In fast-paced environments like SaaS, the LTV calculation is usually kept pretty simple. Just multiply average duration times average revenue per period. If the average customer is with you 10 months and if subscription fees are USD 15 per month, then LTV is 10 x 15 = USD 150.
Of course, if the customer relationship lasts a really long time, and if pricing is expected to change over time, then LTV can be calculated as a net present value. A simple way to do that is with a spreadsheet in which the columns represent time periods out into the future. For each time period, consider the expected fraction of the customer that will still be with you (1-churn x the expected fraction of the customer you had in the previous period) and the expected subscription revenue. Then, discount the expected cash flow to the present using a discount rate (usually your opportunity cost of capital). More complex models of LTV can include factors such as additional products or services that a customer will buy on average in the future.
We’ve considered LTV in the context of low-marginal-cost goods offered on a subscription basis, but LTV can also be used for other settings in which a customer makes repeated purchases over time, say for a neighborhood coffee shop, where the average customer may make one purchase per week and where the churn is 2 percent per week. In such cases, the revenue per time period is not a subscription fee. Rather it is the average gross margin per transaction times the average number of transactions per time period. For example, if the coffee shop earns USD 3 in gross margin per transaction, thus generating USD 3 per week in gross margin, and keeps customers for an average of 1/0.02=50 weeks, then the LTV is 3 x 50 = USD 150.
Customer Acquisition Cost (CAC)
In a world of perfect information you could line up all your customers and know for each customer how they learned about you and what factors caused them to give your product or service a try. Then, you could estimate what you spent to create each of those factors, thus estimating for each customer their customer acquisition cost (CAC, pronounced “cack”).
In reality you rarely know this information with much precision. Sometimes all you know is what you spent on sales and marketing for some time period, say a month or quarter, and how many new customers you acquired. You can then do a simple quotient to calculate your CAC. Say you spent USD 10,000 for the month and acquired 200 new customers. In that case, your average CAC is 10,000 divided by 200 or USD 50 per customer.
Often you can get a more useful estimate by identifying how many customers were acquired via a particular mechanism and what that mechanism cost. For example, if you can discern via the analytics associated with an e-commerce site how many customers were acquired by pay-per-click advertising and you know what you spent on such advertising, you can estimate average CAC for the pay-per-click channel. This more refined estimate by acquisition channel allows you to take managerial actions to increase spending on more efficient channels and reduce spending for those that are less efficient.
Ratio LTV/CAC
In theory you could stay in business with LTV just barely exceeding CAC. But, most businesses aim to acquire customers at a cost of less than a third of LTV, and preferably much less. For example, for MakerStock, a business I co-founded that provides materials and services to designers, fabricators, and creators more generally, the customer lifetime value is about USD 300 per customer and we aim to acquire customers for an average CAC of less than USD 50, giving us a ratio of LTV to CAC of 6.
I believe that there are at least two reasons that in practice the target ratio of LTV to CAC is set to be at least three, and preferably much higher.
First, managers and especially entrepreneurs tend to be optimists, and reality rarely proves as rosy as their forecasts. Perhaps by setting a high bar we are more likely to achieve sustainability. If the target ratio of LTV to CAC is 6, then maybe we’ll hit 4 in reality, which would still work out.
Second, most measures of CAC are averages across a large number of customers. Averages hide the fact that some customers are much more expensive to acquire than others. By using a low average value for CAC as a target, we can be more confident that the most expensive customers, our marginal customers, are still being acquired for less than what they are worth to us.
Some other heuristics are useful in managing unit economics for businesses with repeat customers. Randy Goldberg, co-founder of Bombas, a direct-to-consumer apparel company known especially for great socks, told me that he aims to break even on a customer’s first order, so that CAC is less than or equal to the gross margin on that order. (A link to that interview is in the notes at the end of the chapter.) Then, all repeat business contributes gross margin above and beyond the acquisition cost. Of course we can conjure up examples in which that heuristic is not great (e.g., it won’t work if there is little repeat purchase), but it’s quite useful in its concreteness, simplicity, and ease of measurement. What did we spend to acquire customers? How many new customers tried our solution? What was the gross margin contribution of those new customers? If the gross margin from new customers is greater than what we spent to acquire customers, then we are probably not spending too much on sales, marketing, and advertising.
Recurring Revenue
Investors love SaaS businesses because of their recurring revenue. The product is usually delivered as an “all you can eat” solution with a per-period subscription fee. For instance, at this writing, the small-business accounting solution, Quickbooks, is priced at USD 30 per month for the basic, single-user plan. The beautiful thing about this business is that once customers have been acquired and are using Quickbooks, they are unlikely to stop subscribing until the business changes substantially because of winding down, acquisition, or enormous growth and the adoption of a more comprehensive solution. Because delivering the solution requires almost zero marginal cost, the leaders of Quickbooks can just think about subscription revenue as gross profit. (There are some marginal costs of the solution, such as operating the customer service function and some data hosting and computing requirements, but gross margins for such businesses are so high, often 90 percent or greater, that revenue is a reasonable proxy for gross profit.)
Recurring revenue is usually expressed as annual recurring revenue (ARR) or monthly recurring revenue (MRR). Recurring revenue, particularly ARR, is commonly used as a basis for valuing SaaS businesses in mergers and acquisitions or initial public offerings. ARR and MRR are usually calculated simply as the revenue per period from customers that are enrolled in subscription-based services and thus pay recurring fees. In businesses with extremely high churn, this revenue will of course not recur if nothing is done to replace those customers that churn in each period.
Putting Unit Economics Together in a Financial Model for Low-Marginal-Cost Businesses
Here’s a process for understanding your unit economics and creating a financial model for a low-marginal-cost businesses, particularly SaaS companies.
Set a pricing guide, probably including different categories of customers. Many SaaS businesses offer free options and then set pricing tiers based on features and service levels. These are called freemium models.
Estimate the average revenue per period per customer. This may require estimating the fraction of customers that will fall into each pricing tier.
Estimate churn, either based on existing customer behavior, or based on benchmarks for similar businesses. Using this value for churn, calculate the average duration of customer engagement as 1/churn.
Calculate LTV as the duration of customer engagement times the average revenue per customer per period. (If your business does have significant marginal costs of production, then use average gross margin per customer per period instead of revenue.)
Estimate your CAC, either based on experiments you have done or on benchmarks from similar businesses.
Check that LTV/CAC is greater than three, and preferably much greater. If LTV/CAC is not much greater than three, then you likely don’t yet have a feasible financial model.
Estimate the on-going costs of operating your business. For SaaS businesses, software development costs and sales and marketing expenses are likely the largest elements of on-going cost. Use your estimate of revenue per customer per period to do a break even calculation for the number of customers you need to serve to sustain your business.
Prepare a pro-forma income statement for what the business can look like if you are successful. Also create a second pro-forma income statement for the minimum viable scale. These two financial models represent your goal and your fall back position should things go much worse than planned. For SaaS businesses, you can also estimate ARR for this scenario, which will likely be an important measure of the value of your business.
3. Social Networks (e.g., Instagram)
For social networks, the economic model is rarely as simple as for a classic make-and-sell business in which a discrete unit of product or service is provided in exchange for cash. Instead, two broad methods of monetization of the network are typically adopted.
First, the operator of a social network charges members a time-based subscription fee for use of the network. Because social networks increase in value with the size of the network, the initial fee to join the network is usually low or possibly zero. Then the provider charges a fee for continued use beyond a trial period or for additional features. Such monetization methods are called freemium models, because a free option induces joining and initial use, and then premium option are available as an upgrade for which a user pays a subscription fee. For instance, joining LinkedIn is free. To enjoy the ability to send messages to those outside of the members’ immediate connections requires a paid subscription.
A second monetization model is the sale of access to the social network to other businesses for complementary purposes. The most common complementary purpose is advertising, for which a second category of customer, usually businesses, may pay to reach members of the network with advertising. This is the primary monetization model for Facebook and Instagram. Complementary purposes other than advertising are also possible. For instance, data generated from the network may be valuable to third parties who will pay for access to it. Businesses may pay for direct access to members of the network, as when recruiters use LinkedIn to identify job candidates. As the saying goes, if you as a user are not paying to use a solution, you are not the customer — you are the product.
The unit of analysis for a social network is primarily the active user. There is no standard definition of active, but some common variants are daily active users, weekly active users, and monthly active users, which typically include those users of the social network who have engaged with the product in the specified time period. Secondary units for the purposes of understanding unit economics may be the paid subscriber and/or the business customer that pays for complementary solutions like advertising.
The unit economics for monetization via subscription are similar to those of SaaS businesses. What is the average revenue per customer per time period and how long does the average customer pay a subscription fee? The average revenue per customer is the fees paid in each subscription tier, weighted by the fraction of customers in each tier. For instance if there is a free plan and a plan for USD 15 per month, and if 80 percent of customers are on the free plan and 20 percent pay subscriptions, then the average revenue per customer per month is 0.80 x 0 + 0.20 x 15 = USD 3.00. Average customer duration, as in SaaS, is simply 1/churn. So, if 5 percent of active users churn each month, then the average duration of paid customer engagement is 1/0.05 or 20 months. Putting that together, the customer lifetime value (LTV) would be 20 months x 3 USD/month-user = USD 60 per user. Monthly recurring revenue (MRR) would simply be the number of active monthly users times the average revenue per customer per month, so if the network has 100,000 monthly active users, then MRR would be 100,000 active users x 3 USD/active-user-month = USD 300,000 per month.
For start-ups, estimating the fraction of active users that will pay a subscription fee is probably the result of an educated guess at first. However, the rates are typically quite low, often less than 2 percent. This fraction is likely a critically important parameter, so some benchmarking of subscription rates in the freemium models of related businesses will be highly informative.
For the second monetization method — businesses paying for complementary products and services — the unit of analysis will be the paying third-party customer. For this scenario, the unit economics are exactly as for a low-marginal-cost product like SaaS. You may price per unit of use, as with advertising, or you may price as an all-you-can-eat subscription. In some cases, as with display advertising, the revenues paid by third-party businesses may depend on the number of active users in the social network. In this case, you may be able to express the potential third-party business revenue as a value of each customer in the social network.
Putting Unit Economics Together in a Financial Model for Social Networks
Here’s a process for understanding your unit economics and creating a financial model for a social network.
Decide on a primary monetization model — user subscriptions or third-party fees for access to the platform, such as advertising. In the long run, you may use both models, but typically one or the other will be your initial focus.
If your primarily monetization model is user subscriptions then your user is your unit of analysis. If your primary monetization model is third parties who will pay for access to members of the social network, or for data related to the network, then your third-party customer is the unit of analysis.
Establish price tiers. Estimate the fraction of users or customers that will fall into each price tier, informed by industry benchmarks.
Estimate the average revenue per period per customer, based on a weighted average of the prices for each pricing tier.
Estimate churn, either based on existing customer behavior, or based on benchmarks for similar businesses. Using this value for churn, calculate the average duration of customer engagement as 1/churn.
Estimate LTV from average revenue per period per customer and on average duration of customer engagement.
Estimate your CAC, either based on experiments you have done or on benchmarks from similar businesses.
Check that LTV/CAC is greater than three, and preferably much greater. If LTV/CAC is not much greater than three, then you likely don’t yet have a feasible financial model.
Estimate the on-going costs of operating your business. For social networks, software development costs are likely the largest element of on-going cost. Use your estimate of revenue per customer per period to do a break even calculation for the number of customers you need to serve to sustain your business.
Prepare a pro-forma income statement for what the business can look like if you are successful. Also create a second pro-forma income statement for the minimum viable scale. These two financial models represent your goal and your fall back position should things go much worse than planned. For SaaS businesses, you can also estimate ARR for these scenarios, which will likely be important measures of the value of your business.
4. Marketplaces Connecting Suppliers and Consumers, Sometimes Accompanied by Related Solutions (e.g., Airbnb)
Airbnb is an example of a marketplace, connecting suppliers of short-term housing with consumers of short-term housing. Other examples of marketplaces include eBay, Stubhub, and OpenTable. Marketplaces are also called two-sided markets because they serve two very distinct sets of customers: suppliers of goods and services and consumers of those goods and services.
Sometimes a marketplace is a component of a larger service offering that the organization provides directly. For example, the SaaS company Shopify provides software for operating an e-commerce storefront, but it also provides an app store with third-party solutions for merchants, such as freight calculators or sales tax collection systems. The core solution is the e-commerce SaaS, but a key element of that solution is a marketplace connecting suppliers of specialized application software to merchants who use that software as part of Shopify’s solution.
Occasionally a business that is primarily a marketplace will also directly offer ancillary services. For instance, Doordash is a marketplace connecting restaurants with hungry consumers, but it also directly operates a delivery service (“dashers”) that pick up and deliver the food. In such cases, the company may actually be operating a three-sided market (e.g., the restaurants, the diners, and the freelance delivery people).
Gross Merchandise Value and Take Rate
For marketplaces the unit of analysis is usually the transaction. The sum of all transactions over a time period is called the gross merchandise value (GMV). The marketplace charges fees to sellers, and sometimes buyers.
For most marketplaces, GMV is not a GAAP-compliant measure of revenue, as it does not reflect the actual amount of money that the marketplace earns from transactions. GMV may be used as a supplemental metric to indicate the size and growth of the marketplace, but it should not be confused with revenue. Revenue is the amount of money that a marketplace actually receives from its customers for providing goods or services.
The fraction of GMV that the marketplace retains as revenue before passing on the revenue to the supplier is called the take rate. For example, Airbnb’s GMV for its homes segment in 2023 was USD 29.4 billion, but its revenue from that segment was USD 7.3 billion, corresponding to a take rate of 7.3 / 29.4 = 24.8 percent. Note that Airbnb’s transaction fee on the booking is closer to 15 percent, but it charges several other fees to both hosts and guests so that when taken together the take rate is closer to 25 percent.
Take rate is largely determined by the market power of the platform. Marketplaces have very strong network effects, which can create huge sources of competitive advantage. Airbnb essentially crushed its rivals VRBO, Homeaway, and others in the period 2010-2020 becoming the dominant marketplace for temporary housing. This gives Airbnb substantial pricing power and allows it to earn a take rate of 25 percent. The Apple App Store charges a 30 percent fee for all transactions associated with digital goods made with an iOS app. The fees are lower for small businesses, for physical goods, and for multi-year subscriptions. However, put together, Apple’s take rate is also close to 25 percent. These values of 25 percent or a bit more are about the highest exhibited in practice. Marketplaces with less pricing power or dealing in physical goods have much lower take rates. For instance, eBay’s take rate in 2022 was about 13 percent. The practical range in take rates is typically 10 percent to 30 percent, with most marketplaces operating in the range of 15-20 percent.
Putting Unit Economics Together in a Financial Model for Marketplaces
The basic financial model for marketplaces is comprised of the GMV, the take rate, COGS, and on-going operating costs.
Identify the two sides of your marketplace, likely suppliers of goods or services and consumers of those goods or services. Decide which side will pay for access to the platform, or possibly if both sides will pay. Use competitive benchmarks and a subjective evaluation of your relative pricing power to estimate your take rate, expressed as a percentage of GMV.
Estimate your cost of goods, the direct costs of executing transactions, which may include fraud protection, customer service, and computing resources. For most virtual marketplaces, COGS is a small percentage of revenue. For example, Airbnb’s COGS for 2022 were $1.5 billion, which included expenses such as payment processing, customer support, trust and safety, and host insurance. Airbnb’s gross profit for 2023 was therefore USD 6.9 billion, 82% of its revenue.
Estimate the on-going costs of operating your business. For marketplaces, software development costs and sales and marketing costs are likely the largest element of on-going cost.
Revenue is simply GMV times take rate. Then, gross profit is revenue minus COGS. To achieve financial sustainability, gross profit must exceed on-going operating costs. The breakeven value can then be estimated in terms of GMV, which can be translated into a number of transactions by assuming an average transaction value. Calculate the break even number of transactions and associated GMV you will need to achieve per unit time to meet your on-going operating costs.
Prepare a pro-forma income statement for what the business can look like if you are successful. Also create a second pro-forma income statement for the minimum viable scale. These two financial models represent your goal and your fall back position should things go much worse than planned.
Notes
Fader, Peter, and Sarah E. Toms. The Customer Centricity Playbook: Implement a Winning Strategy Driven by Customer Lifetime Value. Wharton School Press, 2018.
Interview with John Geary, co-founder of Abodu Homes.
Interview with Randy Goldberg, co-founder of Bombas.
I’ve been a product designer or member of a product development team for over 50 new products and services. There’s a magic moment, which never gets old for me, when I see one of my products out in the wild being used by someone I don’t know. These days, the most common encounter is on the streets of San Francisco when I see someone commuting to work on a Xootr scooter. It’s a huge thrill to see evidence that I created something that a stranger felt offered enough value that they were willing to give me more money for for the product than it cost me to deliver it.
I did use the word “magic” to describe a moment, but I don’t want to convey the wrong impression about the overall activity of product innovation. One of the key roles in entrepreneurship or product management is leading the creation of new products, often from nothing. This is sometimes called “zero to one” product development. While luck — or exogenous factors — always play a role in determining outcomes, I believe that any dedicated team with the appropriate technical skills and with effective product leadership can reliably create a great product by using the right product development process, and that the outcome does not depend on some magic ingredient.
Why a process? The zero-to-one process is a codification of the collective expertise of thousands of developers, accumulated in government organizations, companies, consulting firms, and universities from about 1960 to the present, more than a half century of experience. A process informs the team what to do and ensures that no critical step is left out. It allows relative novices to benefit from the learning of others. As an innovator within an established enterprise, you benefit from accumulated experience in your organization codified into a process. As an entrepreneur you can reduce the risk of costly mistakes and more reliably find a compelling solution for your customers by adopting the best practices developed by the many product developers who have come before you.
in this chapter, I’m going to give you an overview of a baseline process, found in almost all organizations, called the phase-gate, stage-gate, or waterfall model of product development. This model is a useful starting point and provides an overall structure to the process of creating a new solution. In the next chapter I’m going to circle back and provide a second, simpler model of design called the triple-diamond model.
Why two models? Let me invoke an analogy to give these two models context. I love tools of all kinds. I have a fancy table saw in my shop that I really value. It takes on big jobs. It’s safe and reliable. It’s powerful and precise. It’s also big, noisy, relatively expensive, and must be connected to a dust collection system. Even so, I couldn’t do without it. That’s like a corporate phase-gate process. But, I also have a compact utility knife that I carry in my pocket pretty much all the time. I use it several times a day. It too is a cutting tool and can even be used for some of the same tasks as the table saw, but it’s unobtrusive, comfortable, and instantly deployable. That’s the triple-diamond model.
Both models are intended to be centered on the customer and to pull from customer needs. In fact, both models include engaging with users in order to identify the needs that are most relevant to product success. Furthermore, the triple-diamond model may be applied recursively dozens of times within the context of an overall phase-gate model — say at a very high level of abstraction to create an overall solution concept, or at a very fine-grained level when refining the user interface for a specific feature.
Phase-Gate or Waterfall Product Development Process
The phase-gate or waterfall process is pretty simple conceptually. First, clarify the job to be done, then understand the needs of the customer, then create a great concept for a solution, then specify details with sufficient clarity that the solution can be delivered reliably and repeatedly to customers. That simple flow is comprised of phases (or stages) — a set of development tasks — separated by gates verfiying that the tasks have been completed before moving on to the next phase.Hopefully you can see how this is a process that pulls from the customer needs to create a solution.
Phase-gate processes are also called waterfall processes because information cascades in one direction, generally from the “what” to the “how.”
Most established companies have their own phase-gate process, and they vary across different product domains. Here’s a fairly typical version. It has these steps.
Mission Statement – this phase results in the definition of the target market, an identification of a persona or representative customer in that market, and an articulation of the job to be done. It could also include a competitive analysis and goals for how the new product will be differentiated.
Product Requirements – This phase results in the creation of a product requirements document or PRD. The PRD includes a list of customer needs, and a set of target performance specifications.
Concept Development – This phase results in an articulation of the solution concept, along with documentation of the concept alternatives, the concept selection analysis, and the results of concept testing with potential customers.
System-Level Design – This phase establishes the product architecture, the major chunks of the product and the interfaces among them, and an analysis of which chunks will be custom, and which will be standard chunks provided by suppliers.
Detailed Design – This phase results in component design and specification, prototyping and testing of the chunks, and key sourcing decisions.
Quality Assurance and Testing – This phase comprises both internal and external testing to verify performance, test customer satisfaction, and to identify bugs.
Launch – This phase includes ramping up production and sales, while assuring early customer success.
For hardware products, there will be a significant parallel set of supply chain and production planning activities to ramp up the supply of the physical product. And, for service products, a pilot will often be conducted.
In any specific organization, the phases in the process are often represented as columns in a table with an implied flow of time from left to right, and the tasks, responsibilities, and key deliverables for each function within the organization are shown as rows.
The gates in the process usually involve a document (e.g., a PRD) and one or more meetings associated with a decision (a) to proceed, (b) to return to the preceding phase for additional work, or (c) to pause the effort entirely.
Evoking the waterfall metaphor, the phases are pools along a river in which substantial work occurs, including some swirling around. The gates are vertical drops between pools, marking the transition from one phase to the next. Water does not typically flow back upstream.
Phase-gate or waterfall processes have gotten a bit of a bad rap, with the critique that they do not allow for downstream learning to affect upstream decisions. However, in virtually every situation I’ve encountered, while the flow is generally from the what to the how, there is some iteration, some hiking back upstream in the process when downstream learning requires a revision in plans.
If you work in software, you know that an alternative process, Agile Development, is very common. Agile deserves its own dedicated explanation, but suffice it to say now that in an agile development process, rather than attempt to fully and completely specify the entire software product in a product requirements document and then build the system in its entirety, the team rank orders the desired features of the system and then builds and tests the features a few at a time, organized into short sprints, usually just two weeks long. Then subsequent sprints take on additional features, but only a few at a time. With an agile approach, the team is guaranteed that it always has something working, and the flexible element of the effort is the scope of features that are eventually built, but not the time allocated to complete the product. Agile processes also benefit from continual feedback on early versions of the product, which allow the development process to be responsive to new and emerging information.
Still, even for software and even in an agile environment, the creation of the first version of the product, the first embodiment of the concept, or what is sometimes called the minimum viable product or MVP, usually benefits from application of the more-or-less standard phase-gate waterfall development process, particularly the first few phases. Once a software or service product exists, its refinement and improvement over the lifecycle is highly suitable for an agile process.
Phase-gate development processes are generally logical and efficient ways to organize the effort of teams and to provide oversight and governance to the creation and improvement of products. For products pulled from customer needs, the process proceeds from a mission, to a detailed description of what the user cares about, to an articulation of the basic approach or solution concept, to a description of the details of the solution, whether that solution is software, a physical good, or a service. When thoughtfully applied, a phase-gate process ensures the organization focuses on the customer, that the landscape of possibilities is explored thoroughly, that no critical tasks are forgotten, and that different functional roles are coordinated.
Appendix – Push versus Pull Approaches to Innovation
One of my former students, Lindsay Stewart, started a company called Stringr. Lindsay had been a producer in the television news business. One of the biggest problems she faced at work was sourcing high-quality video of breaking news. So for instance, if there were a fire in the city, she would really want video footage for her story. She would have to contract with a videographer to go get that footage, edit it, and then to put it into production. That process was time-consuming, expensive, and uncertain.
Lindsay recognized the pain associated with this job and thought there must be a better way. In response, she created an app called Stringr. With Stringr, a news producer can enter a request for a particular piece of video footage via a web-based interface, and then freelance videographers can shoot the video and submit the footage using their smartphone. When the video is accepted, they’re automatically paid about 80 USD.
Is Stringr an innovation? By my definition, unambiguously yes. I define innovation as a new match between a solution and a need. Stringr employs technology to create a marketplace connecting requests for video with the people who can create it, clearly a new match between solution and need. I call this approach to innovation the pull. Stringr was pulled from a pain point Lindsay herself experienced and has proved to be a great solution.
But, innovation can also come about in a completely different way. It can be pushed from the solution. Here’s an example.
The inventor Dean Kamen created a self-balancing wheelchair called the iBot. The big idea was that the device could rise up on two wheels allowing the user to be at eye level with people standing on their feet. The iBot was sold by Johnson & Johnson as a medical device, but once developed, Kamen thought, “Wow we have this amazing technology to balance a wheelchair on two wheels. I wonder if we could find any other application for this solution.” Several of the engineers on the development team said, “You know what? I bet you could stand on a self-balancing platform and ride it around. We could create a personal transportation device for anyone, whether or not they were disabled.”
That thinking led to the Segway personal transporter. One of the applications that the Segway team eventually found was for Police officers, who could use the Segway to get around in environments in which space was constrained, where they wanted to be able to move slowly, and where they wanted a high degree of maneuverability. The Segway was a push – start with a solution – the two wheel self-balancing mobility technology– and find a need that the solution can address, in this case police patrols.
The problem was that once Kamen’s company proved that police officers wanted a low-speed mobility device like the Segway, competitors took a pull approach to innovation and discovered alternative solution concepts that could address that need. In fact, once the police and security markets were proven, established competitors did enter with alternative solutions.
A three-wheeled personal transporter is much less complex than a device that balances on two wheels, and so competitors were able to sell this product at lower prices and with greater performance than the Segway.
While an innovation can be any match between solution and need, and that match can be discovered via a pull or a push approach, three conditions must hold for the innovation to create substantial value.
First, the need must be real. That is, a significant number of customers must have a significant amount of pain, a real job to be done.
Second, the solution has to make the pain go away. It has to actually do the job.
Third, the organization must be able to deliver the solution at a cost significantly lower than the customer’s willingness to pay, and that is, the organization must have sufficient alpha assets to sustain competitive advantage.
Let’s apply these conditions to the Segway example.
First, Segway identified a real need for police officers to get around. The Segway satisfied criterion two as well, the solution concept met the need. But, Segway struggled to be able to offer the product at a price the customer was willing to pay.
The three-wheeled configuration is a lower-cost solution that addresses that same need for police officers to get around. Ironically, Segway itself later introduced a three-wheeled version of its scooter once that configuration was shown to offer greater value.
The big risk with the push approach to innovation is that as an innovator you fail to consider all of the possible solutions for the need that you’ve identified, and someone taking the pull approach runs around you with a better solution.
The innovator that pushes starts with an existing solution and often only considers whether or not their solution will meet the need of the target market. That is a necessary but not sufficient condition.
With the push approach to innovation, an important discipline is to consider how a competitor would approach the identified need, but taking a pull approach. That consideration would probably have led the Segway team to conclude that a three-wheeled solution offers better performance at a lower price, suggesting the team should probably pursue the three-wheeled solution, and abandon the push approach, or else find a different job to be done in which dynamic self-balancing did offer some unique advantage.
While both push and pull approaches can be taken to innovation, In my opinion, the pull approach is much more reliable. The pull approach is at the heart of the zero-to-one product development process I teach, and forms the basis of a reliable and repeatable approach to creating value in product innovation.
Notes
Ulrich, Karl T., Steven D. Eppinger, Maria C. Yang. Product Design and Development. Chapter “Development Processes and Organizations.” Seventh Edition. 2019. McGraw-Hill.
Ulrich, Karl T. Design: Creation of Artifacts in Society. University of Pennsylvania. 2011.
You may believe that you have identified a unique opportunity to create value with your new business. You’re probably mistaken about the unique part. Others have likely tried to do this job before, and some scrappy entrepreneurs just getting started elsewhere in the world probably share your hopes and dreams. Even if your insight is unique, it can’t remain a secret for long. If you are able to grow your business and achieve profitability, you will effectively be publishing the location of a gold mine to the public. Competition is a central, unavoidable characteristic of entrepreneurship. But, competition is not necessarily a bad thing, particularly at the dawn of a new market. Competitors can teach you a lot about what works and what doesn’t, spur you to innovate and move quickly, and share the burden of educating potential customers about an emerging market.
Many aspects of competition are unpredictable and so entrepreneurs should probably not spend inordinate time obsessing over rivals. Still, some attention to competition can result in smarter strategic choices in product positioning and in refining the definition of the beachhead market. Furthermore, potential investors will want to see that you have identified and analyzed the competition and have made sensible decisions about how to direct your efforts given the competitive landscape. As a way to organize this chapter and to avoid unnecessary theory, let me start with an identification of the key questions most entrepreneurs need to answer and the associated decisions they need to make. Then, I’ll illustrate several key concepts, analyses, and ways of presenting information that are most useful in addressing these questions and decisions.
What Questions are You Really Trying to Answer?
Three questions relevant over three different time horizons are usually most pressing.
First, is there really a gap in the market? This is the immediate question relevant to the decision to pursue an opportunity. Entrepreneurial opportunity is born out of disequilibrium, and for start-ups that disequilibrium is usually either (a) some technological change that has given rise to a new solution to an existing job to be done, or (b) some new job to be done that has emerged because of changes in attitudes, preferences, demographics, regulation, or other external forces. A closely related question is how big is the gap in the marketplace in terms of TAM and SAM.
Second, given that an opportunity exists, how should the specific attributes of your solution be positioned relative to the alternatives available to your potential customers? Positioning concerns both the decisions you make about the substantial features of your solution, as well as what you emphasize in your marketing efforts. This question is answered as you develop your solution, refine its characteristics, and craft a message for communicating your value proposition.
Third, how likely is your new organization to be able to sustain competitive advantage in the long term? In most cases a start-up’s most valuable assets relative to larger rivals are speed and agility. But, if you are successful, you will likely become bigger and a bit more sluggish. Existing and new companies will come for your customers. How can you thrive when that happens?
In order to answer these three questions, you’ll first form a hypothesis about the job to be done, the beachhead market, and your solution concept. If you are following the process in this handbook, this hypothesis is developed with the triple-diamond model. In any case, to consider the issues in this chapter you should have at least a preliminary decision in these three areas. In many cases, these preliminary decisions are the key elements of the description of the entrepreneurial opportunity.
With a hypothesis about the opportunity in hand, here’s a process to assess the competition, position your solution, and articulate how you will sustain competitive advantage:
Identify the direct, indirect, and potential competitors and research their solutions and marketing strategy.
Refine and articulate your value proposition by Iteratively refining your product positioning and by mapping your solution relative to those of direct competitors on the dimensions of product performance that most influence the value you offer to your potential customer.
Develop your advantage thesis by articulating your alpha assets, the moats and barriers that you possess or hope to develop over time.
Identify Direct, Indirect, and Potential Competitors
In broad terms, competition is comprised of the organizations that deliver a solution that customers can select to do the job you have identified as the primary focus of your business. These rivals can be categorized as direct competition, indirect competition, and potential competition.
Direct competition refers to organizations that deliver essentially similar solutions to the same customer segment you are targeting and more or less addressing the same customer needs — the Coke and Pepsi of the soft drink market, UPS and FedEx for ground parcel delivery, Nike and Adidas in athletic shoes. Direct competitors are usually the most obvious and visible sources of competition.
Indirect competition refers to organizations that offer a substantially different solution to your segment for addressing the same or closely related customer needs. For example, Peet’s Coffee and Red Bull are indirect competitors for morning stimulants.
Potential competition refers to organizations that do not currently offer solutions to the focal customer segment, but who have the capability and incentive to do so in the future. For example, Amazon and Google are potential competitors in many markets where they do not currently operate, such as healthcare or education. Potential competitors are dormant, but may substantially pollute the attractiveness and sustainability of an opportunity given the possibility they may enter the market later.
Once you’ve identified the direct, indirect, and potential competitors, spend some time learning what you can about them. Devote the most time to direct competitors, but also investigate the indirect competitors; it’s possible they are more aligned with your beachhead market than you think. Your time is probably not best spent going deep on all the companies that could potentially be competitors — too much uncertainty clouds their role in your future. For the most relevant competitors, read white papers and articles; listen to podcasts; watch video interviews; try out their products; talk to their customers. These competitors, as a result of their marketing efforts, have effectively all run experiments out in full view of the public. You should take advantage of whatever information you can glean from what is working for them, what has not worked for them, and what weaknesses are revealed about them by their current efforts.
Refine and Articulate the Value Proposition
When you developed your solution concept, you probably used a concept selection matrix to compare alternatives. (See the chapter on Concept Development.) The criteria you used for comparison included the key customer needs for the beachhead market. Now pull out that list of needs again and revise and extend it until you have 6 – 10 key customer needs that will mostly determine the value that your solution can deliver to your customer.
Needs are usually expressed in the language of the customer, not as technical specifications. At this point you may wish to elaborate the metrics that most closely match each customer need. For instance, if the customer need for an electric vehicle is “has sufficient range for my daily needs” then some metrics might be “range at 50 kph average speed” and “range at 100 kph average speed” which would capture both city and highway driving.
Once you’ve compiled a list of needs, organize them in a table, along with the key performance specifications. Then, fill in the values for your solution and those of your direct — and possibly indirect — competitors. For example, Mokwheel is a relatively recent start-up company entering the electric bike market with the Mokwheel Basalt model.
Here is a table showing the comparison of the Mokwheel Basalt relative to some of its competitors.
Customer Need
Metric
Mokwheel
Rad Power RadRover 6 Plus
Juiced Bikes CC X
Niner RIP E9 3-Star
Lectric XP 3.0
Ride1UP 700 Series
Aventon Level.2
Range
Miles per charge on test course
60
45
30
30
25
30
40
Affordability
Price (USD)
$1,999
$1,999
$2,499
$6,295
$999
$1,495
$1,800
Weight
Kilograms
35.9
34.3
25.0
23.5
28.6
24.5
28.1
Ride comfort
Suspension type
Front fork suspension w/ lockout. Fat tires.
Front fork suspension and rear coil-over suspension w/ lockout
Front fork suspension w/ lockout
Full suspension w/ RockShox ZEB Select fork
Rigid frame/fork w/ fat tires for cushioning
Front fork suspension w/ lockout
Front fork suspension
Payload capacity
Rack weight limit (Kg)
82
45
N/A
N/A
N/A
N/A
55
The hypothesis for Mokwheel is that an affordable, rugged electric bicycle with very long range and huge cargo capacity will be well received in the beachhead market, even if the weight of the vehicle is relatively high.
Product Positioning on Key Dimensions
Competitive positioning is often boiled down to just two dimensions to allow visualization with a scatter plot. For this example, let’s assume that the two attributes of electric bikes that seem to best describe differences in products and in preferences in the market are weight and range.
Given two dimensions, we can then draw a map of the landscape of possible solutions. You could very reasonably object to this oversimplification. You’re right. In virtually any market, we oversimplify by representing the competitive landscape in two dimensions. Still, it’s done all the time, and has an obvious benefit for visualization. Recall that you have already captured the other dimensions that matter in the value proposition table from the previous section. You can experiment with which two dimensions are both important to customers and reflect meaningful differences among competitors.
Note that you can sometimes sneak in a third dimension, say price, by labeling the data markers in the scatter plot, as I’ve done with price below.
In using scatter plots for communicating product positioning, a distinction between two types of attributes is important. Weight and range are largely more-is-better or less-is-better attributes. Everyone can agree that — at least for reasonably foreseeable solutions — more range and less weight are desirable. All else equal, customers would prefer a product located in the upper left corner — low weight and high range. However, cost and technical feasibility likely make that position overly optimistic. In contrast, imagine you are designing a chocolate bar and that the two attributes of greatest importance to customers are (1) intensity of chocolate flavor and (2) crunchiness. For the chocolate bar domain, each customer likely has an ideal point — a combination of intensity of chocolate flavor and of crunchiness that they prefer. The producer can position the solution pretty much anywhere, as most positions are technically feasible at similar cost. Reinforced by these examples, we can probably all agree on some basic principles:
All else equal, a product should be positioned where there is demand.
All else equal, products should be positioned where there is little competitive intensity.
For more/less-is-better attributes, cost and technical feasibility constrain the position of your solution, and you likely will face trade-offs among competing attributes.
By the way, many of you have heard about or read the book Blue Ocean Strategy – that’s all the book really says. Put your product where there is demand and where there’s limited competition. Much of the field of quantitative market research is devoted to increasingly precise methods for measuring preferences and optimizing product positions in a competitive landscape. There’s nothing wrong with that logic or that approach. However, I want to warn you about two ways this approach to product positioning could lead you astray.
First, not every location in this space is feasible. Imagine, we were applying the same process, but for cameras, and our axes were image quality and size. There would be a big open area – a so-called “blue ocean” in the region of very high quality images and tiny size. Yet, the optics of photography introduce a fundamental tradeoff between size and quality, for a given imaging technology. This suggests that product strategy and product positioning in technology-intensive industries are cross-functional challenges, and that engineering breakthroughs are what allow for differentiation. For instance, the advent of computational photography, the use of image processing of several images in order to create one excellent composite image, which underlies much of the power of photography on today’s mobile devices, allows some loosening of the connection between camera size and image quality. In the electric bike market, advances in battery chemistry, motor efficiency, aerodynamics, and tire performance may allow for competitive positioning that beats the basic trade-offs reflected by existing competitors and solutions.
My second concern is probably more substantial. If you find yourself drawing two dimensional maps of your product landscape and debating the fine points of position, or if you find yourself building elaborate mathematical models to estimate market share in a crowded market for products in which a few attributes dominate consumer preference, you are probably not in a dynamic industry with abundant entrepreneurial opportunities. Rather, you are in a stagnant industry in which tuning is done by product marketing managers, and often based on mathematical models and consumer data. The goal is a few additional points of market share. If this is your situation, my advice is to find a way to make this industry less stable, to shake it up, and introduce some new dimensions of competition.
In fairness to the authors of Blue Ocean Strategy, shaking up the industry is more the essence of their message. Avoid head to head competition tuning product parameters within a highly evolved product landscape. Instead, look for a way to introduce new attributes to the competitive landscape. For example, in the chocolate bar space, consider the FlavaNaturals bar, which is made with cocoa that is super concentrated in flavonoids, which have been shown clinically to increase memory. Or consider the KIND bar, which cleverly blurs the boundary between candy and health food. It tempts the consumer with chocolatey flavor while presenting an image of wholesome goodness with the obvious use of nuts and seeds. Those are both competitors that have shaken up the more traditional dimensions of competition in the candy bar market.
Develop an Advantage Thesis
I’ve written a lot about competitive advantage elsewhere. (See Alpha assets and the Five Flywheels.) But, in sum, advantage always arises from controlling or possessing some resource that significantly enhances your performance in doing a job and that your rivals can’t easily get. I call those resources your alpha assets.
A unique solution is usually the start-up’s initial alpha asset. In a few rare instances, the solution will remain hard to imitate for a long time. For instance, in the pharmaceutical industry a new molecular entity can be patented, and what is patented is what eventually receives government approval. Thus, rivals can not offer the approved compound without infringing the patent. Given the typical time requirements for commercialization, such patent protection may offer 10 or even 15 years of exclusivity. But, outside of the biopharmaceutical industry, patents rarely provide strong barriers to imitation for very long (Ulrich, Eppinger, and Yang 2019). Your unique solution combined with your speed and agility probably give you a few years of advantage, at which point you had best have developed other sources of advantage. The most likely are brand and the scale economies enabled by a large established customer base.
Why Can’t Google Do this?
One of the most common questions that entrepreneurs face from investors is “Why can’t Google (or Apple, Meta, Amazon, et al.) do this?” This question reflects the concern that Google, or any other large and powerful company, could enter your market and offer a similar or better solution than yours, using their vast resources, capabilities, and customer base. The “Google question” is common enough to consider specifically. The answer varies depending on your industry, market, and product category. For example, consider how the answer may differ for two start-ups, one pursuing on-line dating and one pursuing cloud-based video services. Although these examples are specific to the competitive threat by Google, they are illustrative of how an entrepreneur might think about competitive threats from any large, powerful incumbent.
Google could enter the online dating market and offer a similar or better solution than a start-up, but it is unlikely that they will do so for several reasons. First, online dating is not aligned with Google’s mission, which is to organize the world’s information and make it universally accessible and useful. Second, the online dating market is fraught with privacy concerns. Google may face legal and ethical issues if it enters the online dating market and uses customer data for matching purposes. Third, online dating is a highly competitive and dynamic industry. Google may not exhibit sufficient agility to keep up with changing customer preferences and needs, as well as the emerging technologies and features in the online dating space. Putting these reasons together, one could argue that Google is not a serious potential competitor in the online dating market. In sum, Google could do it, but Google won’t do it.
Google could also enter the market for cloud-based video services and offer a similar or better solution than the start-up. They might credibly do so for several reasons. First, cloud services is their core business and competency. Google already offers a range of cloud services products such as Google Cloud Platform, Google Workspace, Google Cloud Storage, etc. It has the incentive and interest to enter a niche or specialized segment of the market in order to stimulate demand for Google’s core services. Second, cloud services is a technologically complex industry. Google has the resources and capabilities to enter the cloud services market and offer a high-quality and reliable solution that meets the needs and expectations of customers. Third, cloud services is large and growing industry. Google not only could do it, but Google likely will do it, and has the opportunity and potential to enter the cloud services market and capture a significant share of customers and revenue. If you are in the directly path of a company like Google in its core business, then you will likely need to make an argument about the importance of speed and agility, and some important alpha asset — such as network effects — that can be developed in the two or three years it will take Google to recognize and respond to the opportunity. You may of course also argue that Google would more likely acquire your start-up than build its business from scratch. Such arguments are weak, in my opinion, unless you can make a credible argument for why your start-up will have significant alpha assets within a few years, and in that case, whether or not Google would acquire the company, you have built something of substantial value.
Wrap-Up and Common Pitfalls
Your business plan or “pitch deck,” whether for investors or just for your own planning, should have a section on competition. Everyone expects that, and for good reason. You’ll usually have a table showing how your solution stacks up against the rival solutions on a handful of key customer needs. You’ll likely show your product position relative to direct competitors on a two-dimensional plot. You’ll devote some space to an articulation of your planned sources of long-term competitive advantage.
Do those things and at the same time avoid these rookie mistakes:
Do not claim that you have no competitors or that you are better than all of them. Every job to be done has been around in some form for a very long time in society. Your potential customers were getting that job done somehow before you had your bright idea. The pre-existing solutions are competitors.
Do not be dismissive of competitors. If there is an existing company doing the job you are setting out to do, then that company is more accomplished than you are at the time of your analysis. Show some respect and learn from that company’s experience.
Do not argue that you are the first mover, and that this is a source of competitive advantage. There are rarely first-mover advantages, except sometimes when the market exhibits very, very strong network effects. Consider that Google was not even one of the first ten companies to enter the internet search business.
Do not cite patents or “patent protection” as a significant source of competitive advantage. Unless you are a bio-pharmaceutical company, patents are at best a low picket fence around your solution. They are not typically a significant barrier to entry.
Notes
Karl T. Ulrich, Steven D. Eppinger, and Maria C. Yang. 2019. Product Design and Development. Chapter “Patents and Intellectual Property.” McGraw-Hill. New York.
Kim, W. C., and R. A. Mauborgne. 2005. Blue Ocean Strategy: How to Create Uncontested Market Space and Make the Competition Irrelevant. Boston: Harvard Business School Press.
Let’s say I want to create a better eat-at-home meal solution for work-from-home professionals. That’s not really a strikingly novel problem. Indeed, food and beverage services are some of the oldest businesses in existence. I will face fierce competition to do the job. Why will customers choose my solution and not those of my competitors?
Maybe because I do a better job of advertising, or because my product is more available, or because it’s priced lower. Those things are important for sure. But, much more significant, customers will choose my product if it better meets their needs.
The second diamond in the triple-diamond design process begins with a job to be done, understands the customer needs, and identifies one or more insights. There are two key goals of the second diamond. The first is to comprehensively catalog your customers’ needs. The second is to identify one or two latent needs – needs that are important but not yet addressed in the marketplace. We call these latent needs insights and they are useful in pulling a compelling solution concept when we get to the third diamond.
What are Customer Needs?
We aren’t here only talking about fundamental human needs in the sense of food, shelter, and belonging. Rather, for any given job to be done, customers typically care about 30 to 50 distinct attributes of a potential solution that if provided will result in greater satisfaction. We call these attributes needs, and they tend to vary a lot across individuals. For example, consider these two products. First, the Wendy’s Pretzel Bacon Pub Triple Cheeseburger. Second, the Soylent liquid meal. Both are solutions to the job “How might we provide lunch to hungry workers?” But, clearly the burger is better at meeting the primal craving for fat and salt, and the Soylent is better at meeting the need for high efficiency.
You have a focal customer, or type of customer, sometimes called your beachhead market, and represented by your customer persona. Once you have specified the target segments, a goal of the second diamond is to create a comprehensive list of user needs. There are entire textbooks that teach the methods for understanding user needs. In fact, I am a co-author of one of them (Ulrich et al. 2020). Here is an example of a comprehensive list of customer needs for a music player.
Example comprehensive list of customer needs for a music player.
How to Identify Customer Needs
In sum, you create this list by doing a set of open-ended interviews with individual potential customers. You interpret what you hear and see in terms of the individual underlying needs.
You do your best to express these needs independently of solution concepts. So, instead of stating that the music player has a touch screen enabling a finger to rearrange the order of a playlist, you state that the music player allows the user to predetermine a sequence of songs, a statement independent of any particular solution concept.
Once you have a comprehensive set of unique needs, you arrange them into clusters. For example, the primary need “The music player lets me control the music” is supported by a cluster of secondary needs that are more specific and detailed like “The music player lets me easily find and play music I have enjoyed previously” and “The music player lets me reduce frequency of play of a song.”
The full needs list is important for the ultimate product design. After all, you don’t want to miss anything important. You may also at some point use more formal quantitative customer research tools in order to understand which needs are most important across different market segments and the relative importance of say price and convenience for a particular segment. But, in the triple diamond model of design, our goal is the development of a compelling solution concept, and for that purpose, we are doing an initial exploration of customer needs in order to understand the important unmet needs among our potential customers – what we call an insight.
What is an Insight?
A woman named Emily Harper recently posted a video on the social media site TikTok showing how she prepares ground beef for use in recipes. With the comment that all this fat is disgusting, she is shown first cooking the meat and then washing it thoroughly with hot water using a wire strainer. The video went viral with seemingly half the world aghast that she had removed all the flavor from her food, and the other half thrilled at this revelation of a new technique for healthy living.
Your job as a zero-to-one product leader is not to pass judgment on crazy customer behavior. Rather, you benefit from acting like an anthropologist and asking yourself what deep insight does this behavior reveal about the nature of your potential customers.
In thinking about the opportunity for 99 Bowls, a service providing immediately available yummy food for work-from-home professionals, I hope to observe Emily with a curious and open mind.
The insight I derive from watching Emily going to extreme lengths to adhere to strict dietary constraints is that some individuals feel a compelling need to tightly control the macro nutrient profile of the food they eat.
Among designers, the term insight refers to a user need that is:
authentic
non-obvious, and
significant.
Authentic means that the insight is based on an actual observation of users in the target market.
Non-obvious is self explanatory.
Significant means that if your solution addresses the need it would result in a meaningful enhancement in the value perceived by the customer.
In the second diamond of the triple-diamond model the designer achieves two goals: first, comprehensively identify the customer needs in the target segment and second, flag a small subset of those needs that comprise insights.
Four Categories of Needs
The result of a set of customer needs interviews is a comprehensive list of customer needs, usually 30-50 distinct items. These needs can be sorted into four categories, illustrated by a framework from the Japanese total quality movement of the 1980s and 1990s called a Kano Diagram.
Four categories of needs as represented by a Kano Diagram. (Adapted from original by KTU.)
The horizontal axis is the extent to which the need is satisfied by the solution. The vertical axis is the resulting change in customer satisfaction, or perceived value of the solution.
The “don’t care” needs are needs that are irrelevant to the customer. Address them or not – the customer’s satisfaction does not change. For example, for me, whether or not the food you deliver to me is gluten free, I don’t notice or care.
The “linear” needs are those for which the customer’s satisfaction is essentially directly proportional to the extent to which your solution addresses the need. For example, affordability is often a linear need. When the food is a little more expensive, I’m a little less satisfied.
The “must haves” are needs that if fully addressed do not result in dramatic improvements in satisfaction, but if not addressed at all, result in extreme dissatisfaction. For example, if a food container is microwavable, I don’t particularly notice. However, if the container immediately melts or sparks in the microwave, I’ll be very dissatisfied.
The “latent” needs are needs that if unaddressed are not missed, but if addressed result in surprise and delight. For example, if my food service allows me to precisely specify the macronutrients of my lunch, say 20% carbohydrates, 40% fat, and 40% protein, I’m thrilled.
While there have been some attempts to use the Kano framework quantitatively based on survey methods, it’s mostly conceptual. It gives you a way to think about customer needs and to direct your investment. Ignore the don’t cares. Deliver the must-haves. Invest at competitive parity in the linear needs. But, then, seek out the latent needs like hidden gems. The latent needs are by definition non-obvious. To the extent that they derive from your observation of users, they are authentic. Those that are significant – a big deal for customers if addressed – are insights. These insights will be used in the third diamond to pull compelling solution concepts.
How to do Customer Interviews
OK, but how do I actually get the information to identify the customer needs. Put simply, you get out of the office and interact with customers.
More specifically, you conduct at least 10 one-on-one interviews for each distinct market segment. For new zero-to-one products you’ll probably just have one beachhead market. Perhaps surprisingly, you need just 10 interviews to identify 90 percent of the customer needs that would eventually be revealed by interviewing hundreds of customers.
I recommend you do these interviews as follows:
Identify about 10 potential customers for each segment. These customers need not be typical. In fact, they could be extreme in some ways. After all, our ultimate goal is to find unmet needs, and sometimes the extreme users are better at revealing those needs. For example, if our segment is work-from-home professionals, we might interview some professionals who work from highly remote locations, say a cabin in the mountains. Or, we might interview workers who are extremely passionate about food, so called foodies, say those who are food writers. Or possibly those with extreme food regimens, say adherents of ketogenic diets.
Conduct the interviews either alone or with one other person. You can get by doing them alone, but you’ll find it easier to keep track of what you learn if you have a partner. The other advantage of doing interviews in pairs is that you can engage a lot of people in the process. For example, bringing members of your technical team on interviews is a very powerful way of developing empathy for the customer.
You can use an audio recording device, but honestly I rarely do. I think notes are pretty much just as effective. I think recordings are a bit obtrusive and they are rarely actually transcribed and used. Having said that, I do take a lot of photos and even some short video clips, as the visuals are very helpful in reporting on the interviews and in remembering specifics.
Do the interviews in the customer’s use environment if possible. If interviewing office workers about lunch, do the interview around lunch time at their offices. The reason for this approach is that you are going to observe as much as you are going to listen. You will develop an entirely different and better understanding of your customer if you observe them in their own world.
Plan on about an hour of unstructured conversation. I know this is a bit daunting for many people, but I’m pretty sure you can do it. I have four questions that I use to get the conversation started, but rarely need them. You simply start with an open-ended question related to the job to be done. For instance, “what’s your plan for lunch today?” Once you’ve asked a question, listen carefully to the response and look for an open door. For example, your customer might say, “well, I usually skip lunch.” That’s a huge open door. You know what to do – step through the door by asking, “really? Why’s that?” I guarantee a big fat customer need is about to be delivered to you with that question. The response might be “i’m trying to lose a few pounds” or “I don’t have time” or “I’m planning to eat a big dinner later” or “I forgot to bring my food” – whatever the customer says, you’ll learn a lot. If you walk through a bunch of doors and find yourself way off topic, bring the conversation back to the job to be done with one of your prepared questions. The prepared questions I like are “How do you currently do the job” which you’ll ask more naturally like “what do you do most days for lunch?” or “What issues do you consider when choosing what to do for lunch” or “what most annoys you about lunchtime?” or “what would be your perfect lunch experience?” Any of these questions will result in more open doors – then you step through them.
Whenever possible, ask the customer to show you as opposed to tell you about the question. For example, if the customer responds “I bring my lunch” ask to see the lunch itself. You’re going to learn a lot by observing them. For example, you might learn about office food storage, or dietary preferences, or portion sizes, all revealing of needs in a more direct and truthful way than would be an oral response to a question.
After your interview, sit with your partner and debrief. Revisit the conversation and identify as many needs as you can, even if obvious or obscure. This process results in a long list — usually 30-50 distinct needs. I say usually, but for some complex products there could be many more. I once worked on a project to design a better blood pressure monitor, and we identified about 400 distinct customer needs.
Finally, work to identify those needs that could be considered insights.
What About Large-Scale and Quantitative Market Research Techniques?
The triple diamond model of design is highly effective in understanding latent customer needs and in developing novel solution concepts in response to those needs. However, it has no mathematical underpinnings. There is no notion of statistical significance or estimation of the magnitude of a consumer response to a given feature. Many of you probably have backgrounds in engineering, economics, or mathematics and may be uncomfortable relying on such a qualitative process to create new products.
Of course your discomfort is justified. After all, in business we do really need to answer questions like how big is the addressable market? What should our price point and product specifications be? How will our new product fare in a competitive landscape?
These and other important questions are best answered with quantitative market research tools.
But be careful – the triple-diamond model is intended to engage you in a rich and multi-sensory way with the customer. You won’t achieve that goal with a web-based survey. Avoid the impulse to employ quantitative market research techniques until after you have used the customer-centered, qualitative approach captured by the triple diamond model.
Notes
Ulrich, Eppinger, and Yang. 2020. Product Design and Development. McGraw-Hill.
The triple diamond model is a user-centered approach to design and concept development. The first two diamonds really focus on better defining the “what” – who is our customer, what is the job to be done, and what needs are potentially most relevant to them. In this chapter, we turn to the “how”? Given an understanding of the customer and the job to be done, how can we create a great solution? For this, we use the third diamond, another cycle of divergent and convergent thinking.
I want to underscore that the tools and approaches in this chapter have two contexts for application. First, these tools are used to create a great solution concept in the context of zero-to-one product development – say the original concept for the Strava fitness app. Second, these tools can be used in the daily work of individuals and teams for any kind of design challenge, say improving the social networking features within the Strava app, or even for internal innovation problems like how we might increase retention of customers on the Strava platform.
What makes for a great concept?
The goal of the triple diamond model is to deliver a great solution concept. But, what makes for a great concept?
A concept is a preliminary description of how you plan to do the job for the customer.
For physical goods, it’s usually a sketch of the physical embodiment of the solution. For example, here are 10 concepts that were generated by two of the students in my product design class at the University of Pennsylvania to do the job of carrying an ID card, a key, and perhaps a mobile device unobtrusively underneath clothing. They called the resulting product the underwallet. They did a particularly nice job of illustrating these concepts by hand.
For services, the concept is often illustrated with a visual storyboard, or possibly simply with a paragraph of text.
For software, the concept is usually illustrated with the screens that comprise the user interface on a mobile device or desktop computer.
Not all concepts are equally good. Here are the four characteristics that I believe make for a great concept.
1. Addresses Needs
The first and most important characteristics of a great concept is that it addresses the needs of the customer.
Here’s an example. I love Google Docs. The concept is a word processing tool that runs in the web browser with no downloads or installation required. The file is stored in the cloud and is backed up automatically with a history of prior versions. The file can be accessed from any device, including my mobile phone, or from multiple devices simultaneously. Search works great, allowing me to find a document with just a few keystrokes. The software is clean, simple, and fast. I can share a file with anyone or everyone with a couple of clicks. I can export the document as a PDF file if necessary. Other than one tiny complaint about how bullets are formatted, this product is perfect for my needs.
2. Cost Efficient
The second characteristic of a great concept is that it is cost efficient. Here is an example of a cost-efficient packaging concept. Many of you probably know about GLIDE dental floss. It was pioneered by the company WL Gore. It’s made from Teflon or polytetrafluoroethylene. The compound is very slippery and so glide is particularly valuable to customers whose teeth are tight up against each other. Thus, the name Glide.
Glide itself is an interesting product, but it’s the package that I want to talk about for a minute. The Glide floss package is a single injection molded part designed with a living hinge that allows it to both fold into the deployed configuration, include an integral cap, and to be configured in a way that it can be molded as a single piece, and in a way that the part can easily come out of the mold.
My guess is that the manufacturing cost of this package is a few cents. Although the smooth pebble-like form is unobjectionable, the glide concept really shines not because of its beauty or function, but because of its extreme cost efficiency.
3. Wow Factor
The third characteristic of a great concept is what I call the wow factor. Here’s an example. I have an app on my mobile device called “Picture This.” I was riding my mountain bike this past summer and sat down for a rest. I smelled an interesting minty fragrance, which seemed to be coming from foliage near my feet. I snapped a photo using PictureThis and within seconds the app told me I was looking at Mountain Monardella, also known as mountain coyote mint. Who knew? Picture This has a bunch of nice features including the ability to keep a database of plants previously identified. But, the wow evoked when some image processing algorithm identifies a plant from a snapshot is magic.
The wow factor is valuable for at least two reasons. First in a commercial context, if you have some wow, then you typically also can achieve some intellectual property protection, usually in the form of a patent. This can provide a modest and temporary barrier to competitors replicating your design.
The second reason, and perhaps the more important reason, is that if you’ve got some wow in your concept, then you have something to talk about in the market, and you can get a user excited about the product. In a commercial setting it allows for your product to distinguish itself from the competing alternatives.
4. Aesthetics and Elegance
The fourth and final characteristic of a great concept is aesthetics and elegance. That is, as designers we should strive to create things that are beautiful. I can wax on about the beauty of purely functional objects, but automobiles are perhaps more interesting examples because they embody a complex bundle of function, identity, and meaning. When Volkswagen announced its all electric microbus, it revealed a concept to which a lot of attention had been paid to aesthetics, including a careful and tasteful reflection of the heritage of the original VW van.
OK so those are objectives. We want to create something that meets user needs, can be produced at low cost, has some wow, and is beautiful.
Concepts for Digital Goods
The four elements that make for a great concept are particularly important for physical goods and for services. In both physical goods and services, cost is critically important. However, for digital goods, cost is usually less important.
Furthermore digital goods can often be thought of more as bundles of features than as a single distinctive solution concept. These features can be added and subtracted incrementally over time as the product evolves.
Perhaps in part for these reasons, the development of a great concept tends to receive less attention for digital goods than it does for physical goods or services. Zero-to-one product managers sometimes feel that a software solution concept follows directly from the job to be done and the customer needs, and even if it doesn’t, the solution can be refined over time.
I think this view is a mistake. Digital goods offer almost unlimited flexibility in solution approach, so if anything, a thorough exploration of the solution landscape is even more important in digital goods than it is in physical goods.
Let me give you a few examples of distinctive concepts in digital goods.
Twitter – what’s the concept? A social network organized around the idea of followers in which an individual creates a virtual bulletin board, usually viewable by the public, in which messages of 144 characters or less are posted chronologically. Messages are pushed to followers and appear on a scrollable feed. (Of course many features have been added over the years, including direct messaging, the ability to respond to tweets, the ability to like tweets and so forth, but the original and still essential concept is quite distinct.)
Slack – what’s the concept? SMS/Txt for work, organized around topical channels. The big idea is to consolidate information and discussions into threads by topic to avoid the chaos of email. Again, many additional features have been added over time, including document sharing, emoji responses, push notifications and so forth. But, the big idea remains asynchronous communication for work organized by topic.
Tinder – what’s the concept? A mobile-only dating app focused on photos, in which individuals express interest in a potential partner by swiping an image to the right, and rejecting a potential partner by swiping an image to the left. When and if two parties swipe right on each other, the app declares a match and allows the two parties to start a conversation via text message.
Strava – a GPS-enabled fitness app, originally focused on running, in which an individual’s route and running time are automatically recorded, and then shared with a network of other runners. The route is automatically divided into segments and a leaderboard is established for the fastest times along those segments.
Because these concepts have been so successful, we take them for granted, even assuming that there could only be one way to do things. But, that perception reflects a hindsight bias.
There are a huge number of possible solution concepts for virtually any problem domain. For example, consider the simple task of listening to pre-recorded music using a digital device. What are the different ways that might be done?
One early solution, Apple iTunes, had these key elements. The iTunes store in which you could buy individual songs, originally for USD 1 each. Then, local storage of those songs in a master library on a physical device. Then, the creation of playlists from the master library. That was it.
A very different, and quite revolutionary concept arrived with the service Pandora. With Pandora, a user simply typed a single song or artist into a web-based application and Pandora created a virtual radio station based on other songs that shared the same “music genome” – Pandora’s name for the distinctive musical elements of a song. No need to create playlists. Pandora does it for you, and you can have as many stations as you want for free, if you are willing to listen to some audio advertisements, or if not, for a single monthly subscription fee.
Then, Spotify came along with an all-you-can-eat subscription service in which you could create playlists from extensive available catalogs, but without actually having to own and keep track of the digital content itself.
Today, YouTube Music is a significant player in the music space. The insight addressed by YouTube is that in many settings people really want the option of viewing video of the artists from live performances or highly produced visuals.
I know some of you are thinking that these different ways of listening to music are now blended together on many platforms. For example, Spotify allows for downloading of files for off-line listening and allows for the use of Pandora-like stations. By the way, I recommend the “dinner chill” station for nice music for dinner parties.
This convergence is a reflection of the massive amount of experimentation and innovation that competitors have engaged in over about two decades at the beginning of this century. At some point preferences of customers became clear, market segments came into focus, and the solution concepts matured and became fairly stable. This is the normal pattern of evolution in an industry.
The maturation of the approach an industry takes to doing a job is another reason concept development may not be emphasized as much as it should be for digital goods. So often the product manager joins the team long after the original solution concept was established. Anyone joining Strava today as a product manager would not likely be doing a zero-to-one design for a new app, but rather would be improving and tuning an existing app. Still, even in this context, the skill of concept development is important. Even if you are working on some small feature within a larger established product context, you should strive for a solution concept that meets needs, is cost efficient, has some wow, and is beautiful.
Concept Development – Basic Approach
The essence of the third diamond in the triple diamond model is another cycle of divergent and convergent thinking.
Concept generation and selection is essentially a mini tournament of ideas. We’re going to generate a lot of alternatives; a dozen or maybe even a hundred different solution concepts. We’re then going to select from among those in order to find an exceptional concept. For most people this does not come naturally. The good news is that as with most challenges in life, a little bit of process and practice goes a long way.
Before we get into the mechanics of how to actually do this, I want to emphasize three points.
First, I want to emphasize that concept generation is really hard. It takes much more effort than most people appreciate. I do not want to sugar coat this reality. Here’s an example to illustrate what I mean.
Some of you might have noticed a little stick figure in some of my illustrations. The stick figure is one element of one graphic in a few sessions of one of my courses. There are hundreds of such elements.
“Stick Figure” in lower left
But that little stick figure concept is the result of deliberate exploration. I went back through my files and I found this sheet showing more than 100 different alternatives for what that stick figure might look like. I eventually found one that I thought worked quite well. Some of you are rolling your eyes and thinking how can it possibly be worth investing that kind of effort in a stick figure. You could be right.
But, the point I want to make here is that the tiniest design challenge when done well still requires tremendous effort. This is hard work. You need to be prepared to do the hard work to get great outcomes.
As a slight aside, let me make a comment about life and professional success more generally. You should embrace things that are hard, especially when by hard, I really mean just putting in the effort. If you can internalize the idea that great concepts are mostly the result of hard work, while others believe a spark of creative genius is required, then you have a superpower. You can be confident that if you do the work using a solid process, you are going to get better results than everyone else, and all you have to do is show up and do the work.
The second point I want to make about exploration is that we need to be open to ideas that come from anywhere and everywhere. Sometimes it’s even dumb luck that leads to a great design concept.
Here’s an example. I’m the inventor of a product called the Nexride bicycle seat. Let me tell you where the concept came from. A few years ago I was working on creating a better bicycle seat. As part of the process I was testing out several of the existing non-traditional products. I was out riding one of the saddles that’s essentially a bench-shaped form mounted perpendicular to the direction of travel.
So, I’m out riding about 30 kilometers from home when the clamp that attaches the seat post to the frame breaks. This meant not only that the seat fell down so that it was right up against the frame, but also that it was free to pivot side to side. I considered walking home, but then decided I should try to ride the bike anyway, as that approach would still be faster than walking. To my dismay I discovered that the pivoting action allowed by the lack of a rigid clamp made the saddle much more comfortable. It allowed the bench to get out of the way as my leg extended on the down stroke.
I immediately went home and created a prototype of a pivoting bike seat, and I eventually ended up inventing a new saddle, the Nexride bicycle seat.
I say “invent” but really that concept came from a dumb accident – a broken bolt out on a bike ride. I’m not complaining. In fact, I’m emphasizing that you need to be open to the possibility of ideas from any source including random occurrences.
Lastly I want to point out that even though we have a process, and I am going to teach you some methods for doing exploration, please understand that concept generation tends to be highly iterative. It’s quite likely that as you generate ideas, the definition of your job to be done will come into better focus. It’s also quite possible that as you proceed to refine a particular concept and build and test prototypes, you’ll have additional ideas for new concepts. That’s normal. Don’t be alarmed. That iteration is fundamental to the way design happens in practice.
A few years ago I founded a company called Terrapass. We provided a service to offset the environmental footprint of driving a car. Given the complexity of understanding what and how we actually mitigated environmental damage, we settled on a solution concept that was very simple. For one fixed fee, USD 79 per year, we would provide enough carbon dioxide credits to offset the emissions of your car. See, it’s really, really hard to explain the product clearly. Still, what we discovered was that our customer was really interested in the details, and had a deep appetite for understanding the nuance of the environmental impact of driving. We found that we had to modify our concept, and actually increase complexity by adding a highly customizable emissions calculator to our website. This solution allowed the customer to precisely specify the make and model of their car, the amount of driving they did, and their driving habits. Iteration on the solution concept is usually required in order to achieve great outcomes.
Ideation process
I’ve mostly talked about the third diamond in generalities. Let’s dive into the details, starting with the divergent part. How can you reliably generate a lot of solution concepts?
The human mind is pretty good at thinking of solution concepts, especially after considering carefully the job to be done and engaging with the customer. So, before getting too fancy, just write down or sketch out any ideas you have from the top of your mind. In my experience, you already have at least three or four ideas.
Now comes the part that really differentiates expert creators from novices. Just put those ideas aside. They may eventually prove to be the best solution to the job at hand. But, experts know that those ideas are not going away. You’ve already captured them. So, just let them go for now. Move on and see if you can generate another half dozen or more alternatives.
You can use some simple techniques to stimulate your thinking. Here are five that I like.
First, pull from insights. You’ve already invested heavily in the second diamond, understanding the customer, and that effort should have produced a couple of insights. Insights are customer needs that are authentic, non-obvious, and significant. I guarantee you that if you identify an insight, a solution concept will just fall out of your mind.
Let’s try it. My hoped-for new venture 99 Bowls makes and ships frozen prepared lunch foods like soups, chowder, and chili to professionals working from home. In my customer research, I identified the insight that many people strive to tightly control the macro nutrient profile of their food. For example, some want higher fat and lower carbohydrates, and others low fat and high protein. Can you think of any solution concepts for 99 Bowls that would be responsive to that insight?
Of course you can. Here are a few. How about starting with standard recipes, say for chili (a mexican-inspired spicy soup), but whose ingredients can be adjusted in a custom production process to deliver a pre-specified macro nutrient profile? Want higher fat and lower protein? Increase the amount of cheddar cheese and reduce the amount of ground turkey. Want higher carbohydrates? Substitute corn kernels for the cheddar. Another would be to have a vast assortment of soups, but then to automatically filter the options to those that satisfy the customer’s desired nutrient profile. A third option would be a sort of bento box that assembles different food items – say sliced turkey, pita chips, hummus, and cheese – into a lunch portfolio that satisfies the overall target nutrient profile.
In fact, the whole purpose for finding those insights in the first place is to use them to pull distinctive solution concepts. This technique is the most powerful item in your concept generation tool kit.
A second approach is to apply the decomposition principle, focusing on just one element of the job to be done. You can decompose by customer needs, which is essentially what we do when focusing on an insight, or you can decompose by sequence of user actions or according to different sub-functions within a larger solution. For example, for 99 Bowls we might decompose the overall service into selection, ordering, delivery, and consumption. Now, focus on just one of those functions and consider all the different ways you might do it. For instance, consider delivery. 99Bowls could ship a carton of 12 individual servings that are frozen and placed in insulated packaging. Or, the customer could pick up a month’s supply at a regional refrigerated drop-off point. Or, a single serving could be delivered ready to eat at a pre-specified time each day. Or, the company could locate a compact freezer in apartment complexes and neighborhoods acting as a sort of vending machine for meals that have been pre-purchased. We could follow the same process for the other sub-functions, say selection. Once the decomposed problem has been tackled, pieces that work together can be assembled into complete solution concepts.
In a third approach, consider how an organization with a distinctive approach to product would solve the problem. For example, how would the Japanese household products company Muji implement 99 Bowls? I’m envisioning very tidy and beautiful containers, likely rectangular in shape that stack into a modular storage and shipping solution. The containers are either reusable or returnable. How would Nike do it? Maybe with selections endorsed by famous athletes – say the Michael Jordan meal plan. How would Netflix do it? They would make meal suggestions based on my eating history. You get the idea – take the best elements of the distinctive approaches of other companies and see how they might apply to your challenge.
Fourth, consider analogous problem domains. 99 Bowls is trying to solve the problem of what’s for lunch while working from home. What’s an analogous problem? Maybe the problem of what to watch at home in the evening. How do I solve that problem? I have different channels and platforms like YouTube, Disney, HBO, and Hulu. Maybe I can have different lunch channels, with varied offerings.
Fifth, set a numerical goal. I generally like to use a goal of 10 distinct solution concepts. Over thirty years of teaching product development, I’ve found that the number 10 is challenging, but achievable. If you have identified 10 distinct ways to do a job, you have probably done a decent job of covering the landscape.
All else equal, the easiest way to find a better idea is to generate more ideas. And, the easiest way to generate more ideas is to engage more people. Engage your team. Engage your engineers. Engage your customers. Ask anyone who will listen if they have suggestions or ideas about how to do the job.
One technique I like when working with a team, is to prepare in advance a list of what I call Emergency Stimuli. These are prompts that might dislodge new ideas. Here’s an example of some stimuli for the 99 Bowls challenge.
What food trends are taking hold in restaurants located around busy office complexes? Might some of those trends be applied in a home delivery service?
As increasing numbers of professionals work from home, what are the most common complaints about the experience? Might 99 Bowls address some of those pain points?
What innovations in food science are emerging, but perhaps not yet widely available? Might some of those innovations be incorporated into the 99 Bowls solution.
In my experience, almost any prompt will work to get team members unstuck. Just think of a handful of questions that can nudge people to think differently, and then use those questions when and if the ideation process gets stalled or people complain they are out of ideas.
The divergent portion of the third diamond is all about generating a lot of alternatives. There’s no shortcut, other than perhaps the trick of involving a lot of people, which certainly makes the task easier. Apply the process, do the work, engage a team, and you’ll end up with a rich set of solution concepts.
Harnessing the Power of Individuals and Groups
Some projects are completed by individuals working alone, but more typically you will find yourself in a team. How can you most effectively harness the power of individuals and groups to generate concepts?
The most common organizational practice is to call a meeting and to conduct a brainstorming session. You’ve all done this. You get a group of people around the table. Maybe you have a flip chart and an easel or a whiteboard, and someone facilitates the meeting.
I exaggerate only slightly in saying that this is probably the single worst thing you can do in order to effectively deploy your team.
Let me make an analogy. Imagine that you and your team are on a small plane that crashes on a remote island. Everyone survives but your first task at hand is to find food, water, and shelter – this is the metaphorical equivalent of looking for a great solution concept.
Now imagine two strategies. In the first, the team huddles together in a rugby scrum and you wander around as a group looking at the ground together. That’s the equivalent in organizational life to calling a meeting.
In a second scenario, everyone on the team heads off in different directions, with the mandate to come back and report on what they found after 30 minutes. Then, after sharing information you all go look more carefully in the most promising areas.
Hopefully your intuition is that the second approach will more reliably find the best food, water, and shelter. This same strategy of employing independent parallel exploration is also the best way to engage a group in concept development.
You don’t have to take my word for it. My colleagues Christian Terwiesch, Karan Girotra, and I have tested this idea experimentally. We compared two different approaches to ideation. In what we call the group approach, four people work together for 30 minutes. In a second technique, we call the hybrid approach, those same four people work for 10 minutes alone as individuals independently and in parallel and then those four people work together for 20 minutes exploring the ideas that they generated alone as individuals.
We did this study with 44 individuals divided into 11 groups of 4 and we had them work on exploring for alternatives for two different product design problems.
We found that with the hybrid approach the same 4 individuals could generate about 2 – 1/2 times more ideas if they took the hybrid approach than if they worked together as a group.
Not only that but the ideas they generated were actually better in quality as well.
We have unambiguous evidence that a hybrid process is better than a group process and that you need to have an individual phase for at least some of your exploration effort.
It’s very helpful to provide a numerical target for that individual phase. I usually use a goal of 10 ideas per individual.
Lastly, some people find out that it’s very hard in some organizations to actually get people to do their homework – that is to actually do the assigned work of generating 10 ideas working individually.
If that’s the case for you, then I recommended you go ahead and call a meeting, which is effective in getting people to allocate some time. But then after you’ve called the meeting and after you’ve got people together, you ask them to work alone for the first 10 minutes, after which you can proceed to work together as a group.
Just to be sure I’m clear, I want to reiterate that I’m not opposed to working in teams. Rather, you should cherish the value of the team resource and work to deploy it most effectively, by having your team members spend some time working individually and alone before you bring together team members into a group process.
Selection Methods and the Concept Selection Matrix
The third diamond in the triple-diamond model includes a convergence from many solution alternatives to a single plan for going forward. We clearly shouldn’t pick from our alternatives at random. How do we converge?
In most cases, the convergence comprises two steps. First, the team, without the benefit of any external testing, narrows a set of 10 or more solution alternatives to a few, say 2 or 3. Second, some kind of testing with potential customers is used to converge on the best single solution. Here I focus on the first step – screening and selecting internally.
The technique used most widely in practice is multi-attribute utility analysis — which is an overly fancy name for a criteria matrix. Even if you don’t know the technical name, you’ve probably used one of these tables before. In this example I use a google sheet to quickly create the matrix, but any table will do, even a marker on a whiteboard.
Just as an arbitrary convention, I like to use the columns for the different solution alternatives and the rows for the criteria.
A desirable characteristic of a structured selection method is that you can remember, codify, and communicate the logic behind a decision long after it has been made. The selection matrix is self documenting. So, if you do use a whiteboard, remember to snap a photo for archival purposes.
For physical goods, I find it is sometimes nice to draw a little sketch next to the textual description of the concept at the head of each column. You can also use a separate document with illustrations to document in more detail each of the concepts captured by the matrix.
The rows of the matrix are the selection criteria. I like the criteria to be the key customer needs. In this example I’ve shown three needs – quick and easy to use, removes all the ice cream from the container, and forms a nice ball. Almost always there are three additional criteria that apply, and they are cost or some measure of the economic efficiency of delivering the solution, wow, that is how fundamentally interesting and novel is the solution, and elegance and beauty. These criteria map directly to the universally desirable attributes of a solution concept.
Now you just consider the relative performance of each concept relative to the criteria. The convention that I like to use for representing relative performance is a three level scale using a plus, a zero, and a minus.
Note that even though I use the term cost here, I adopt the convention that plus is always better, and minus is always worse, so a plus indicates lower cost.
Once you’ve evaluated all of the concepts relative to all of the other criteria, you can then summarize the net score by adding up plusses and subtracting minuses for each concept.
One positive outcome of the selection process is that it helps the team to realize when elements of one concept might be combined with another, or when concepts are actually quite similar to each other. For instance, as a result of this process, I discovered that concept E was conceptually very similar to concept G, a concept that I ended up pursuing further.
In this example, two concepts really stood out as superior, and so I focused on those two for further development. I often see three concepts that emerge as most promising. Rarely does a team have more than three really compelling concepts based on this internal selection process.
Now those of you who are more right brained have an objection. You argue that we can’t really reduce everything in life to a quantitative evaluation. Instead you need to make a more holistic judgment of the qualities of the concepts.
I hear you on this point, and I think it’s good discipline to see if you can get the concept selection matrix to be consistent with your intuition. That suggests that you’ve been able to capture what’s really behind your intuition, and that will benefit you when you go to communicate your rationale to other people, maybe to the more left brain of the stakeholders on the project.
[As a complete aside, I know remembering what those terms left brain and right brain mean is really hard – they are terrible labels. Here’s the mnemonic device I use. Remember that LEFT is LOGICAL…]
Those of you who are more left brained have your own objection. You argue that not all criteria are equally important and that it’s hard to reflect accurately the relative quality of concepts using just three levels.
Of course both of these concerns are valid. For this quick selection method to be effective, the criteria need to be roughly equal in importance, and in some cases, a crude three-level quality rating will mask some huge differences in relative quality of concepts. You can of course easily modify the criteria matrix to increase the number of quality levels, say using a 1 to 5 scale, and you can weight the relative importance of the criteria using a percentage weighting scheme or a point system. However, in my experience, if the goal is merely to narrow a set of alternatives to about three, then the simple criteria matrix will work quite well.
Concept Testing
In the third diamond, we are sort of flying blind. It’s been a while since we engaged with our potential customers. For this reason, we need to do some concept testing.
Let me illustrate why this is so important using a simple example. Imagine you are designing a new hot sauce. (Have you noticed by the way that I use a lot of food examples? That’s because I love food.)
You can think of any individual as having an ideal point, which is their true preference, say on two dimensions of saltiness and spiciness. When you interview them and observe them, they tell you how much salt and heat they like – maybe they tell you they like it really hot and not very salty. Of course, you as the designer don’t hear them perfectly well, and they are not perfectly accurate in describing what they like. There’s inevitably some imprecision.
Then, you go to the lab and create a product based on what you understand, and there is a further translation error in that execution. By the time, you’ve gone through three phases of interpretation, what you have cooked up and what the customer wants are likely not perfectly aligned. Correcting any such mismatch is not hard. You give them a prototype of your hot sauce and ask them what they think. Yikes, they say, that’s too hot and tastes sort of bland. Hopefully you land pretty close though, and can incrementally refine your solution to hit the target.
Of course, I bet very few of you are designing hot sauce, but the same logic applies to creating a service experience or a piece of software. What the customer tells you, how you understand it, and the fidelity of your engineering process will inevitably result in a mismatch between what the customer actually wants and what you have actually built. Concept testing lets us estimate whether or not you have a good match before you actually develop the product.
There are three common types of concept tests. The first is informal qualitative feedback based on a quite schematic description of the solution concept. For example, this is the very first prototype of the Apple iPod. It was made by Tony Fadell from cardboard covered with a laser printed graphic. I bet it didn’t take more than an hour to build.
Source: Tony Fadell. Build.
You can’t have too much feedback on prototypes. Even showing potential users hand-drawn screens on paper – sometimes called “paper prototypes” – is super helpful in clarifying where the solution concept misses the mark.
In a second type of concept test, you set up a forced choice among a small set of concept alternatives, usually three.
For example, here is a forced choice concept test for three ice cream scoop concepts. The 3 options typically result from an internal concept selection process using a criteria matrix in which 10 original concepts are narrowed to 2 or 3.
You can use this kind of forced choice in lots of different design settings, not necessarily just for overall product concepts. Here’s another example of a forced-choice survey I used in testing three possible names for the environmental services company I co-founded. The name Terrapass was the clear winner and we went with that option.
In a third type of concept test, you ask potential consumers to indicate their purchase intent. Purchase intent is almost always measured using a five-box scale, from definitely would not purchase to definitely would purchase.
Here’s one of the ice cream scoop concepts as it would be used in a purchase-intent survey.
Purchase intent surveys are notoriously imprecise in predicting demand, but they are the best single predictor of consumer acceptance of a new product at the concept phase of development. I believe they are best used for relative comparison of several concepts. In my own research, I have found that you can test up to 50 concepts with a single respondent without too much fatigue, and that you only need a sample of about 15 representative consumers to get a reliable estimate of how potential customers will react to your product.
Of course the way you represent solution concepts to your audience influences their response. For example here’s the same purchase intent survey with the concept illustrated with a photo-realistic rendering. In this case the vibrance of the color is much more evident than with a black-and-white line drawing.
You will probably not have the details of your concept fully worked out when you engage in concept testing, so you will have to just do your best in representing the solution. In my opinion, consistency in the fidelity of the concept descriptions across different concepts is more important than the absolute level of quality of the representation of your concepts.
More Iterative Refinement
If you are very lucky, you will find that the concept you select (1) meets the customer needs, (2) is cost efficient, (3) evokes the “wow” response, and (4) exhibits beauty and elegance. More likely, significant iterative refinement remains as you put prototypes in front of potential customers and refine your solution. That’s normal. Hopefully, however, the results of a deliberate concept development process get you close to the target and a process of incremental improvement will allow you to hit the bullseye.
Notes
Karl T. Ulrich, Steven D. Eppinger, and Maria C. Yang. 2020. Product Design and Development. McGraw-Hill. New York.
Laura Kornish and Karl T. Ulrich. 2014. The Importance of the Raw Idea in Innovation: Testing the Sow’s Ear Hypothesis. J. Marketing Research.
Karan Girotra, Christian Terwiesch, and Karl T. Ulrich. 2010. Idea Generation and the Quality of the Best Idea. Management Science. Vol. 56, No. 4, pp. 591–605.
Tony Fadell. 2022. Build: An Unorthodox Guide to Making Things Worth Making. Harper Business.
I’ve been a product designer my entire adult life. Here is one of the products I created, the Belle-V ice cream scoop. In full disclosure, I had a lot of help from a talented team. When people see the product they impute genius to the designer – wow, that’s amazing. How did you come up with that?
I’m using an example of a physical good for specificity, but I’ve experienced the same kind of reaction to digital products and services.
The reality is that I learned an effective process when I was in my 20s and I’ve applied that process repeatedly, sometimes weekly or even daily for 40 years. When you only observe the outcome, the results seem magical. But, the truth is that a fairly straightforward sequence of process steps can reliably lead you to a great result.
Design is just another word for the pull approach to innovation. All design processes are a sequence of steps that begin with some articulation of the “what” and result in some description of the “how” – the process moves from what to how.
Commercial phase-gate product development processes are just an elaboration of that basic idea, with lots of detail. My textbook on product design and development (Ulrich et al. 2020) is a comprehensive description of that detail. Most of you working in larger organizations probably use some sort of phase-gate process that is specific to your industry.
But, here I’m going to abstract a bit, and focus on the elemental design process – what is design at its very core. While design is the core problem solving approach within the product development process, design can be applied beyond product development. It’s almost a building block of being human – of dealing with life.
My goal is to describe the design process in a way that it can be used in myriad situations, from the creation of a new product from scratch, to the improvement of an existing product, and even for solving internal innovation challenges such as finding new ways to reduce waiting times in emergency departments.
To reiterate, the standard phase-gate product development process is a fully elaborated methodology that typically includes the roles of different functions within the organization. It emphasizes not only what to do in each phase, but the notion of a gate that must be cleared in order to proceed to the next phase. I am now going to boil that basic process down to its essence to give you a tool I call the triple-diamond model that can be used not just in zero-to-one product development, but also in almost any other problem solving situation.
To give credit where credit is due, the triple-diamond model is my extension and elaboration of the Double Diamond Model articulated by the UK-based Design Council, a non-profit organization with the mission of improving design practices.
The three diamonds correspond to three steps.
Clarify the job to be done in a jobs analysis.
Understand the needs of the customer or user.
Create a great solution concept.
In practice, a fourth phase is usually important – implementing that concept in a way that the organization can actually deliver the solution. This involves writing the code, designing the parts, and planning for production.
The three diamonds each represent a cycle of divergent and convergent thinking. For each diamond, the designer explores alternatives, and then focuses.
The first diamond answers the question, “What is the job to be done?” It starts with a target customer and the gap or pain point as you have first sensed it, and it results in a carefully considered reframing of the design problem in terms of a job to be done. In fact, one of the critical elements of an effective design process is not even really problem solving so much as problem definition.
The second diamond begins with a job to be done and develops a comprehensive understanding of the customer needs, which are those aspects of a solution that could result in satisfaction and even delight if satisfied. The convergent portion of the second diamond identifies one or a few insights, which are essentially important customer needs that were previously not known.
The third diamond uses those customer insights to pull many possible solution concepts and then selects one or a few for further refinement and testing.
Let me show you how the three diamonds played out for the Belle-V scoop. I started with a vague sense that ice cream was really hard to scoop. In diamond 1, I focused on the at-home consumer of ice cream and came up with the job to be done “How might we better dispense bulk ice cream into individual portions?” In the second diamond, I observed people scooping ice cream and noticed that the wrist angle was quite awkward, even painful for some people. That insight allowed me to pull several different solution concepts, including the one that eventually was embodied in the product, a more or less conventional scoop, but with the scoop angled relative to the handle.
Of course, really, it’s diamonds all the way down. The triple diamond model focuses on the concept development process, but when the team proceeds to build the product based around a concept, it will almost certainly use additional cycles of divergent and convergent techniques in order to solve downstream problems, say for establishing a product architecture, or implementing specific components of the solution. For example, even after we had converged on the solution concept of an angled scoop, we did a huge amount of exploration to find the final form of the object. Another diamond focused on the detailed design of the shape of the scoop and handle. And for that matter, there was another diamond when we considered the surface finish of the scoop – divergent exploration of alternatives and then convergence on tri-valent chrome plating.
Some of you are thinking that this model seems pretty tidy for a very simple piece of hardware like an ice cream scoop, but may not apply to more complex goods and services, say to enterprise software or to a hotel experience. I have a couple of reactions to those reasonable thoughts.
First, as an aside, there’s a reason they call it HARD-ware – it’s hard. Even a simple object like an ice cream scoop presents a lot of complexity and challenges when it comes to actually getting it to the marketplace.
But, more substantively, for new, zero-to-one systems, software, or services, you must still devise an overarching solution concept. For example, consider LinkedIn – the top-level solution is essentially a user-created resume-like profile with the ability to establish a connection between two individuals, and then the ability to search 1st, 2nd, and 3rd order connections in the resulting professional network. Such an overarching concept could be developed with the triple diamond model.
For established systems, the triple diamond will be unlikely to be applied to the entire product or suite of products, but rather more likely to a feature within that more complex product. For example, once LinkedIn had become a successful product, the triple diamond model could still be applied, but to a new feature, say the creation of the follower feature, which allows individuals to follow another person and get updates that person publishes, but without requiring the individual to become a bi-lateral connection.
Problem Solving, Design, and Design Thinking
I happened to be on a holiday ski trip when I was writing this chapter. (I know, that doesn’t sound like that much of a holiday.) I kept thinking to myself, skiing is fun, but it’s a huge annoyance to actually get on the slopes. For most novice skiers, you have to procure skis, boots, poles, helmet, goggles, and warm clothing. Then, you have to put all that stuff on. Then, while fully dressed in really warm gear you have to walk awkwardly from transportation to a ski lift, sometimes navigating a flight of stairs. Then, you put on the skis. By then you are sweating and your goggles are fogged up. Next you wait in a line. Then you get on a windy and cold ski lift and become quite chilled. When you finally get to the top of the mountain, you stare at a map trying to figure out the best route down. Finally, you get to slide on the snow, which is actually quite fun. I’m an incurable innovator and so I found myself posing the question, “How might we improve the experience of getting skiers onto the slopes?”
If I were a trendy corporate consultant, I would call this a “design thinking” problem. But, I’m actually a bit of a crusty old designer. I’ve taught design for more than 30 years. So, I have to ask “what exactly is design thinking” and how is it any different from plain old design?
Well, first let’s first go back to the definition of innovation and design.
I define innovation as a new match between a solution and a need. Innovation can result from a push – starting with the solution and looking for a need. For example, what might we use the blockchain for? Or, it could start with the need and pull the solution, like I framed the skiing challenge. “How might we improve the skier experience?” Design is innovation anytime you are pulling a solution from a need.
So considering our definition, the short answer to what is design thinking is that it is design. Really. You apply the same process to creating a better ski experience as you do to creating a better ice cream scoop, or a better fitness app. In fact, the word design thinking annoys a lot of designers, because they are usually less interested in thinking about problems than in actually solving them.
Once I cool off a bit about the weird term “design thinking,” I realize there may be a gem of an idea in there, and that a bit of nuance may in fact be warranted.
A useful definition of design thinking might be that it is design of things we don’t normally think of as designed.
For example, here are some problems for which the design process could be used, resulting in solutions that would not normally be thought of as designed artifacts.
How might we improve the patient experience in the emergency department at our hospital?
How might we improve the convenience of using a bicycle for transportation?
How might we create a delightful food delivery service?
A lot of people talk about needing to apply more design thinking in business. I find myself wondering if the desire for design thinking is really just a reaction to the use of too many spreadsheets and PowerPoint presentations, disconnected from customers and from exploration of solution concepts. This reaction reflects a desire for a different and better culture of innovation.
I do think that good designers exhibit a few desirable elements of culture. Interestingly, most of these elements don’t need to really be confined to design. Here are five:
Designers exhibit a bias for action.
Designers tend to be optimists, exhibiting a culture of yes.
Designers tend to use exploratory prototypes early in the problem solving process.
Designers tend to be skilled at visual expression.
Designers tend to use empathic methods for understanding customers.
Despite my enthusiasm for all things design, I won’t argue it is universally the best approach to problem solving. For example, it would be a mistake to abandon elements of Six Sigma, Total Quality Management, the Toyota Production System, and data-based approaches. It would also be a bad idea to use a design process to find the volume of a geometric shape, a task better suited to an algorithm.
But, for a huge set of challenging problems, design is a great approach. It is fundamentally divergent and open-ended in its perspective on addressing user needs, and that’s useful whether you are designing a bridge, enterprise software, or an insurance claims process.
Notes
Karl T. Ulrich, Steven E. Eppinger, and Maria C. Yang. 2020. Product Design and Development. McGraw-Hill. New York.
Most investors agree that the two most important factors in a decision to invest are the market size and the quality of the team. This chapter focuses on market size.
The most common ways to think about market size, and the estimates most institutional investors expect to see are:
Total Available Market (TAM – pronounced as a word like “ham.”). Sometimes also total addressable market. The market value of the job to be done for all segments.
Serviceable Addressable Market (SAM as in a person named “Sam.”). Sometimes also segmented addressable market or serviceable available market. The size of the market you could reasonably serve with your solution and business model in the medium term.
Serviceable Obtainable Market (SOM, as in the nickname for a sommelier) – sometimes also share of market. essentially the market the company may credibly expect to obtain with available resources in the near term, say 24 or 36 months.
Some investors, advisors, and entrepreneurs (including me), prefer to define an additional category, the beachhead market. Getting a company up and running is really hard. Going after the biggest market segment is not necessarily the best strategy. Often the biggest market segment will demand aggressive pricing and thus significant cost efficiencies. Most start-ups won’t be equipped to tackle the biggest segments from the start. A beachhead market is one that provides the easiest access, allowing the fledgling business to get started, to develop a little traction, to build some scale, and to refine its products. The beachhead market is always a subset of the SAM. The desirable characteristics of a beachhead market are:
The needs of the beachhead market are not being served well by competitors.
You can access the customer using focused, efficient acquisition techniques as opposed to broad-based awareness campaigns.
Specific customers are readily accessible for engagement in refining a solution.
Your value proposition, even as a young company, is compelling.
For goods and services requiring physical operations and logistics, the beachhead market is often geographically close to the start-up location.
The boundaries of these definitions are somewhat arbitrary, and so my primary recommendation is to be extremely clear about your definitions and careful with your assumptions. One of the biggest sources of delusion in entrepreneurs’ pitch decks is wildly unrealistic estimates of market sizes.
Top Down Estimates
There are two ways to think about market definition and sizing, top-down and bottom-up. With the top down approach, start with all economic activity on earth – that’s the maximum size of the market for “do everything.” Then, successively narrow the definition of the market until you get to the “market for the job that we aspire to do in society.” That’s your total available market (TAM). Then, further narrow to markets for which you can offer a value proposition in the medium term with your solution – the serviceable addressable market (SAM). Then, further narrow to the first market segment you will focus on and for which you offer a value proposition — the beachhead market. Each narrowing is a defined subset of a larger market.
For example, let’s revisit MakerStock (originally described in the handbook as “University Panel Supply”).
The GDP of the entire planet (c2023) is approximately USD 100 T.
The subset of that GDP representing the market for plastic, wood, and metals used in making things, and excluding construction, is approximately USD 6 T.
The subset of that market for plastic, wood, and metal panels (e.g., large sheets of material) used in making things is approximately USD 700 B.
The subset of that market comprised of specialty plywood (which excludes softwood plywood used in construction), medium-density fiberboard, and acrylic sheet is USD 44 B.
The US portion of that market is USD 5 B. (Now we are focusing geographically.)
The US market for these materials in which the customer’s ideal format is a less-than-full-sheet custom size with delivery by conventional ground freight is USD 500 mm. This is the subset of the market for which a cut-to-size supplier of materials would offer a value proposition. This particular focusing step is where you might sense we are pretty much guessing. There is no place to look up market sizes for the “cut to size” panel market, and we are left to doing some back-of-the-envelope calculations. For this reason, top-down estimates become a bit shaky as additional focusing assumptions are made. Still, USD 500 mm is a reasonable estimate of the TAM for MakerStock — the market is certainly smaller than USD 1 B and it’s more than USD 100 mm. The definition of your TAM is somewhat arbitrary. For instance, this estimate of TAM is for the US only, but might we reasonably consider serving customers in Europe, for example? Given that many different assumptions are possible, just be very clear about the focusing decisions that underly your estimate of TAM.
MakerStock’s TAM includes cabinet makers and raw materials for factories producing finished goods in relatively large quantities. MakerStock is unlikely to be competitive for these segments in the medium term. The company is likely to offer a stronger value proposition to customers that prefer custom sizes and that order a variety of different materials, both wood and plastic, for use in their fabrication processes, largely laser cutting. The US market for such materials for university maker labs, do-it-yourself individual makers, and small- and medium-sized businesses such as sign making shops is approximately USD 100 mm. This is a reasonable estimate of the SAM for MakerStock.
Now, how will MakerStock get started? Where will it focus initially? MakerStock will focus on university maker labs. It will focus on those labs that can be served by FedEx ground freight within three days of Scranton, Pennsylvania. The beachhead market is for pre-cut specialty plywood, medium-density fiberboard, and acrylic sheet for university maker labs located within the three-day ground shipping territory from Scranton, Pennsylvania. Top-down estimates are going to be very approximate for the beachhead market. To do a top-down estimate, we might gather some estimates (guesses?) of a few knowledgable people and average them and assume that 10 percent of the SAM is the beachhead market, delivering a market size of USD 10 mm. Bottom-up estimates are much better for tackling this estimate, the approach I will explain below.
With each successive focus on a subset of a larger market, we are making a decision about which narrower market will be more readily addressable by the new venture. Each narrowing reflects a belief which may or not be correct. For instance, commercial sign makers may be a better beachhead market than university maker labs. So, as with any problem solving activity, considering alternatives and testing beliefs will likely result in better outcomes.
For the top-down approach, conventional internet search and current AI tools are probably the best source of raw data. By using a variety of queries and triangulating on the result, you are likely to be able to make estimates that are well within one order of magnitude of the actual value.
TAM and SAM depend on the definition of your core business
Estimating TAM and SAM requires that you assume some boundaries for your core business. For instance, if I conceive of my panel supply business as providing panels of any type to any user of panels globally, my TAM is USD 700 B. But I really have to stretch my imagination to believe I can address the need for particle board panels purchased by the Chinese factories that make the best-selling IKEA Billy bookcase. Those factories are likely purchasing many full truckloads of those panels per week directly from the mill that makes them. The definition of available and addressable determines your TAM and SAM. I like to think of addressable customers as those customers who have a job to be done for which the core business could reasonably be competitive in delivering a solution. For MakerStock, that core business is sourcing sheet goods by the full truckload, breaking the bulk delivery into sheets, cutting sheets to custom sizes, and delivering pieces by conventional ground freight. The job to be done is to deliver an assortment of the right materials, at the right time, in the right sizes, all with minimal fuss. The serviceable addressable market is the size of the market for which that value proposition makes sense, a market not of USD 700 billion but rather about USD 100 million.
Bottom-Up “Counting Noses” Approach
The top-down approach is a useful way to put the business into a larger context, and to reveal possible additional market segments, and their sizes. However, the bottom up approach is usually more credible and less speculative. WIth the bottom-up approach, you start with a hypothesis about the beachhead market — the very first market you will tackle. You estimate the size of that market by creating an inventory of every potential customer in that market. This approach is called counting noses.
For example, the beachhead market for MakerStock is university maker labs located within the geographic region served by three-day ground shipping from Scranton, Pennsylvania, the initial location of the business. The business was located there because I as founder already had a facility and an available team member in that location, and because that location is a logistics hub, serving about one third of the US population within two days by conventional ground shipping. The geographic cut off reflects a belief that freight costs would be decisive in the value proposition to our customers.
Once that beachhead market is defined, counting noses is easy. First, there are about 5300 colleges and universities in the United States. Now, look up the ground delivery time map that FedEx provides. Identify those universities within the three-day shipping territory. That subset is about 2500 institutions. This set of 2500 potential customers can be identified and cataloged precisely and entered into a database. For each potential customer, say PennWest Edinboro University, an internet search can reveal whether or not it has a maker lab, and possibly unearth a name and contact information for the lab manager. In fact, an internet search for the PennWest Edinboro furniture design program yields a great description of the program, including photographs displaying specific details about the equipment and furniture in the shop. That search even produces a name of the program director, Karen Ernst, along with her contact information. We can now count Professor Ernst’s nose in our beachhead market. Doing a comprehensive search for all 2500 potential customers is probably not a good use of time until the business is actually launched, but doing that search for a sample of potential customers, say a hundred, produces an accurate estimate of how many labs would eventually be found in all 2500 universities. For this example, a preliminary search suggests that about 64 percent of these universities have at least one maker lab, a potential customer base of 1600 labs.
At this point, some assumptions are required about the average level of spending on speciality plywood, medium-density fiberboard, and acrylic by each lab. That estimate can be based on interviews with a sample of customers. By talking to about five potential customers, we found that the average spending seemed to be roughly proportional to the size of the university, with a university spending an average of about USD 4 on these materials per year per student enrolled. The labs serve an average of 1250 students each, so their average spending on materials is about USD 5000 per year. These figures lead to an estimate for the total size of the beachhead market of USD 8 million per year (i.e., 1600 labs at USD 5000 per year). This a pretty solid number. The real value might be USD 10 million or USD 6 million, but it’s not USD 50 million or USD 1 million.
Consider Adjacencies for a Bottom-Up Estimate of SAM
Once you have identified and characterized a promising beachhead market, now consider the immediately adjacent markets. The adjacencies might be geographic. So, after considering colleges and universities in the northeast, consider those in the mid-Atlantic region, or the mid-west. The adjacencies might be in the goods and services offered, for instance extension of the product line from wood and plastic to metals. The adjacencies might be in the types of target customers, for instance from colleges and universities to secondary schools, or to small and medium-sized businesses using laser cutters. These adjacencies taken together comprise your SAM, as estimated using the bottom-up approach. As a matter of good planning hygiene, consider how your bottom-up estimate of adjacent markets compares with your top-down estimate of your SAM. These two ways of getting to SAM should not deliver wildly different results.
Estimating SOM
Recall that SOM is the market you plan to actually serve within your planning horizon, usually 24 or 36 months. For my taste I prefer estimating SOM with a bottom-up, counting noses approach of the beachhead market integrated with some estimates of the rate of customer acquisition of the go-to-market system.
Recall that we estimated that there are 1600 potential customers in this beachhead market. I believe we can acquire an average of two new repeat customer per week with the likely sales and marketing resources we will have, net of churn. (See the chapter on go-to-market systems for how to think about this.) Thus, within three years, we will have approximately 300 university maker labs as repeat customers. We estimated earlier that each lab orders approximately USD 5000 in materials per year. Thus the recurring revenue for the customer base at year three will be approximately USD 1,500,000 per year, at which point we will have about 19 percent market share of the beachhead market of USD 8 million. Of course, even though we will focus on the beachhead market, we will unavoidably reel in some customers from adjacent markets, and likely will also sell to some do-it- yourselfers via the MakerStock website. It’s even possible that an adjacent market will prove to be a better fit for the company than the beachhead market we had originally envisioned. Still, the bottom-up nose counting along with some realistic modeling of the go-to-market system is a grounded approach to forecasting the scale of the business.
Fables Versus Realism
None of you readers are too excited about recurring annual revenue from the beachhead market of USD 1,500,000 after three years. Investors likely would not be too excited either. Yet, that’s actually an above-average outcome for a start-up in year three. I have invested in over 50 start-ups. About five of those have achieved recurring annual revenue of USD 1,500,000 by the end of year three.
Every founder faces many dilemmas. One of the most pressing is whether to spin a compelling fable in the pitch deck, which probably represents a 95th percentile outcome, or to provide a realistic forecast of what you believe to be a highly obtainable outcome. I believe the level of conservatism in the forecast depends on the audience. If you are planning to be a closely held, bootstrapped, company, then you should strive for hard, cold realism, even pessimism. That was my approach with MakerStock. I funded the business with my own money. I wanted to have a realistic sense of how the business would unfold and how much cash I would need to burn to get to positive cash flow. MakerStock actually did substantially better than the forecast, largely because do-it-yourselfer and small- and medium-sized business customers turned out to be fairly easy to acquire and serve alongside universities. That was a pleasant surprise easily accommodated as the business developed.
If, however, your audience is institutional investors, then they are highly conditioned to see forecasts at about the 95th percentile. My advice is to be excruciatingly clear about your assumptions and logic in estimating TAM and SAM. Those need to be highly credible. Then, the estimate of SOM should likely skew a bit optimistic, assuming that you have all the resources you need, including that investor’s capital, and that things go well. Your SOM is going to be discounted by institutional investors seeing your pitch, so you should account for that fact in your presentation. (Yes, I realize this is a pernicious cycle of optimistic forecasting and assumed discounting by the investor. I don’t see a clear way around it.)
Market Size Graphics
The most common way market sizes are shown in pitch decks is with nested circles, sometimes called an onion diagram, in which the area of the circle is proportional to the market size. Data graphic purists may prefer bar charts of some kind, but I think the nested circles work pretty well and you probably want to avoid bucking convention here. You can, of course, annotate this graphic heavily to support the numbers.
This little piggy went to market, This little piggy stayed home, This little piggy had roast beef, This little piggy had none. This little piggy went … Wee, wee, wee, all the way home!
Mother Goose
What is Go to Market?
Go to Market or GTM is a term of art originally used in the enterprise software industry in Silicon Valley. At first glance, you would understandably think the term referred to the activities a company takes to launch its product in the marketplace. The product is done, and then “this little piggy goes to market.”
But as used in Silicon Valley, go to market is better defined as:
The system by which a company transforms its addressable market into its customer base.
Another reasonable definition is:
How we convert a potential customer to a delighted customer.
Or even:
How we sell stuff.
(But, this last definition fails to emphasize the importance of deliberate management of customer success to ensure long-term value for both customer and supplier.)
GTM is an on-going operating system – an engine – which is developed, refined, and operated over the life of a product to grow revenue. In most settings, the GTM system is the second most important design challenge a new venture faces, closely following the design of the solution itself.
In some (relatively rare) settings the relationship between customer and supplier consists of very few transactions and a limited on-going relationship persists. For instance, one of my former students Ajay Anand founded Rare Carat, a marketplace for diamond engagement rings. Notwithstanding exceptional potential customers like actress Elizabeth Taylor who was married eight times, the modal number of transactions Rare Carat will have with a customer is one. Go to market for Rare Carat is pretty simple – gain awareness, encourage trial of the service, and convert trials to ring purchases.
At the other extreme are enterprise software companies like Salesforce. It may take significant effort to acquire a customer, but once acquired, that customer is likely to remain a source of revenue for many years.
Here are some of the activities that comprise the GTM system in many organizations:
Creating awareness of the company’s solution.
Encouraging consideration and trial.
Supporting selection of the company’s solution.
Pricing the solution for a specific customer.
Delivering the solution, including associated hardware, software, and integration with the customer’s existing operations and activities.
Training the customer and ensuring effective adoption of the solution.
Up-selling and cross-selling additional solutions.
Scaling a business requires efficient processes that can be reliably replicated. Just as an industrial process like making automobile tires could not possibly be scaled efficiently without a codified process, so a GTM System can not be scaled if not codified.
Two Basic Types of GTM Systems – Product-Led Growith (PLG) and Customer-Led Growth (CLG)
Although every GTM system is different to meet the specific needs of a company, two basic types of GTM systems are common: Product-Led Growth (PLG) and Sales-Led Growth (SLG).
Key Characteristics of Product-Led Growth (PLG)
An example of PLG is the video conferencing tool Zoom. Product situations for which PLG may be effective include:
The customer can deploy the product without assistance.
There is a practical mechanism for a potential customer to try the product at low or no cost.
The product is intrinsically viral (e.g., visible in use, sharing is integral to use of the product, novel and interesting).
The effort and time required by the customer from the adoption decision to realization of significant value is low.
Key Characteristics of Sales-Led Growth (SLG)
An example of SLG is the human-resource management enterprise software product Workday. Product situations for which PLG may be effective include:
The product requires a significant effort to provision and set up.
The product lacks intrinsic virality (e.g., not readily visible by others; not intrinsically interesting or novel; sharing or connecting with others not an organic element of the use of the product).
The effort and time required by the customer from the adoption decision to realization of significant value is high, often USD millions over years.
The GTM Canvas
You can represent the GTM system with a GTM Canvas, a template which works for most settings. Here is a GTM Canvas as a Google Sheet. This is the GTM Canvas for the now familiar MakerStock example.
The Customer Journey
The backbone of the GTM System is the customer journey. To fill out the GTM Canvas, start with the customer journey.
The journey starts with the customer’s job to be done. The journey is complete when the customer is committed and delighted to be using your solution to do the job.
All customer journey’s include at least these touch points:
Awareness of the company’s solution.
Consideration of the solution relative to competitive alternatives.
Decision to try or adopt.
KPIs
The development of key performance indicators (KPIs) for the GTM system begins with a metric for the desired result. For example, for MakerStock, the desired result is a satisfied customer, defined as:
MakerStock is the primary supplier of panel goods for the lab. The lab is purchasing in regular intervals with order sizes of at least USD 800. The institution has set up an account and is paying via bank transfer or check (to avoid credit card fees). We know the lab manager’s name and preferred mode of contact and have interacted one-on-one. The lab manager is highly satisfied with MakerStock’s services and would recommend MakerStock to others.
The KPIs for this desired result are the number of satisfied customers, the number of new satisfied customers obtained this week, and the average net promoter score (NPS) of satisfied customers.
KPIs should also reflect the state of the intermediate phases in the customer journey. For example, how many potential customers received a quote this week, and how many potential customers have received a quote within 60 days but have not placed an order.
Finally, KPIs should also reflect key actions that serve as inputs to the GTM system. For instance, how many outbound email inquiries to potential customers were made this week.
Process for Designing GTM System
Ideally you will have just one GTM system, but will probably eventually have to create variants for very different segments. For each segment, proceed as follows.
Define the focal market (usually the beachhead market for a start-up) and the job to be done.
Define a goal state for the customer. Success is usually a delighted customer for whom your product is accepted as an integral element of how they do the job.
Map the phases in the customer journey, from “potential customer” to “delighted customer.”
Create the playbook for the transitions between phases using design thinking, experimentation, analytics, and iterative refinement.
Establish ownership of each playbook and the handoffs between functions (e.g., sales to customer success).
Select KPIs for the most significant elements of the GTM system, for both results and key process steps.
Once you believe your GTM system is approximately right, consider the GTM as a process flow and work out yields and flow rates to deliver desired growth targets. This step is useful for testing the feasibility of efficiently acquiring customers and for establishing budgets for sales and marketing efforts.
Complications
Two complications are common in creating GTM systems: (1) platform and marketplace products and (2) multiple segments with multiple channels.
Platforms and marketplaces
Platforms and marketplaces are sometimes called two-sided markets because they bring together suppliers of goods and services with consumers of those goods and services. The solution serves two very distinct types of customers and users. Some sales and marketing activities, such as general brand awareness, may serve both sides of the market. However, almost certainly, two very different GTM systems are required for two very different segments. The GTM systems can be conceived of independently. However, in operating the GTM systems, the two sides of the market must be kept is approximate balance — and so those responsible for the two GTM systems must coordinate with each other, and resources may need to be allocated dynamically across the two systems in order to keep supply and demand in equilibrium.
Multiple segments
Good advice in general for new ventures is to focus on one beachhead market. In that case, the company will have just one GTM system. Inevitably some distinct market segment will emerge. Sometimes that segment can be accommodated with a variation on one or more steps within a single GTM. For instance, for MakerStock, the GTM system is designed for universities, but when a high school emerges as a potential customer, the GTM system can pretty easily accommodate it with some minor differences (e.g., awareness of summer shut down dates, central school district billing systems, higher price sensitivity).
Sometimes a new market segment is so different that it requires that the GTM system be forked. For instance, the do-it-yourself (DIY) consumer segment became important to MakerStock during the 2020, the year the Covid19 pandemic was most severe. At that time, the university GTM system was simply not relevant. Keyword advertising was the key mechanism for gaining awareness and trial for the DIY segment. The sales and marketing playbook for the DIY segment is so different from that of the university lab segment, that MakerStock created an entirely separate GTM system for that segment.
Assignment
Complete a GTM Canvas for your new venture. Again, here is a template for the MakerStock example. (You will of course need to “make a copy” or “save as” in order to create your own version.) You need not use Google Sheets if you prefer some other tool (e.g., Miro).
Craft a one-slide description of your GTM system for the purposes of your pitch deck.
I enjoy cooking. I’m not one for recipes, and I especially like making savory stews and soups from seasonal vegetables, and with interesting spices, especially cumin. I usually make a big pot and after enjoying a nice dinner, I’ll stow away a few leftovers in serving-size containers in my freezer. Few moments give me greater happiness than when I remember I have something yummy in my freezer ready to heat up for lunch.
A while back I had an idea. Why don’t I create a service, which I’ll call 99 Bowls, which periodically sends me a carton of 12 containers of interesting soup? That way I always have something yummy to eat when I’m on my own at home for a meal.
I’m a serial entrepreneur, and this is how a new venture often starts for me. I’ve got some itch myself and I conceive of a company to scratch that itch. Let’s call this the raw opportunity.
A jobs analysis is a good first step in exploring an opportunity. It results in a clear and deliberate articulation of the job to be done for a focal customer (Christensen et al. 2016). The jobs analysis also comprises the first diamond in the triple-diamond model of design and design-thinking.
Let’s first talk about that focal customer. Before you even consider how to solve a problem, you really need to think about “for whom”? Returning to the 99 Bowls example, the product I would create for delivering pre-made meals to a school cafeteria would be dramatically different from the one I would create for a professional office worker or for a graduate student.
Two concepts are useful in identifying the focal customer. First, for zero-to-one products, you should identify the beachhead market. By this I mean the very first group of customers you will target. The best beachhead markets are those with the biggest need, the most acute pain point, and those that you can most easily reach. These markets are usually not the biggest markets. (See this chapter on defining markets for more.) The biggest markets usually have to wait until you have some experience and have started to spin up the flywheel of greater cost efficiency in your business. For 99 Bowls, a beachhead market could be relatively affluent professionals working from home at least two days per week.
The second useful concept is the persona. A persona is a description of a hypothetical customer that is highly representative of your target market. This is useful in making the challenge real to your team and to other stakeholders. A persona is usually constructed with specific attributes like age, gender, professional role, and even personality characteristics.
Let me tell you about the persona for 99 Bowls. Her name is Grace. She works as a product manager at Facebook. She’s 36 years old and lives alone with her cat Milo. She’s super fitness-conscious religiously going to a yoga class near her house in San Francisco every day. She works at home most days, although occasionally takes the Facebook shuttle to the main office about an hour away in Menlo Park. Grace is Korean-American and finds most prepared food too bland. She’s a foodie and likes a lot of heat and flavor. Makes it real, doesn’t it?
Persona Grace via Midjourney
Your target segment will probably change, and after launching your solution you will almost certainly discover that there are other customer segments that your solution can address. You’ll also inevitably want to expand into adjacent segments. But, you have to start somewhere and specificity helps guide the creation of a solution.
I do a weekly podcast with entrepreneurs and my informal tally of past guests suggests that for about half of them the genesis of their business was a need that they themselves experienced. This raises the question of whether or not it is good practice to use yourself as a target customer.
Here are a few thoughts. First, you will find yourself in many professional situations in which you are not the target customer. If you are creating heavy equipment for the mining industry, you probably are not also a mine owner or equipment operator.
Second, when you are representative of your target market, I believe you are highly likely to create a product that satisfies at least one customer. You. That’s actually no easy feat. It’s a real luxury in entrepreneurship to have an immediate intuition about whether a solution is near the mark or not.
Still, designing for yourself does not guarantee a big market. You represent one data point and in most cases you aspire to serve thousands or even millions of customers. Disciplined and experienced entrepreneurs are able to leverage their own deep intuition about the job to be done while understanding that they need to be able to assume the perspective of the broader market for long-term product success.
Jobs Analysis and the Abstraction Ladder
In one of the most highly cited articles ever in Harvard Business Review, Theodore Levitt wrote “customers don’t want a ¼ inch drill, they want a ¼ inch hole.” Levitt’s insight was that when customers consider your product, they have a job to be done. They don’t typically want your product per se, they want the results of a job it can do for them.
But think about this example a bit more. I don’t know many customers who really want a ¼ inch hole either. They want to fasten a bookshelf to the wall. And do they really want to fasten a bookshelf to the wall, or do they want to store their books?
Every gap, as you first sense it, exists within an interconnected network of alternative problem statements, some more abstract and some more specific.
Here’s a technique called the abstraction ladder for elaborating the alternative ways you could state the design problem. You use the abstraction ladder for divergent thinking, to consider alternative ways you could frame the job to be done.
First, state the problem at the top of mind using the phrase “How might we…” For example, recall the 99 Bowls opportunity, which I could state as “How might we periodically deliver containers of prepared soup to work-from-home professionals?” You might write this on a self-stick note and place it on a wall or your desk.
As an aside, we use the phrase “How might we…” really just to put ourselves in a divergent frame of mind, considering many possibilities, some of which may not even be feasible.
Now, ask yourself what desirable outcome would be achieved if you solved the problem as stated. Or, in other words, why is that problem worth solving?
For example, we hope to deliver prepared soup so our customer always has something readily available to eat for lunch. Now, use that desirable outcome as the foundation of a second, more abstract, problem statement — “How might we provide a work-from-home professional with something to eat for lunch that is always readily available?” As these motives for doing the job come to mind, just write them down on separate notes and stick them higher up on your work surface.
You see what we’ve just done? We’ve moved up a rung on the abstraction ladder to state our problem a bit more generally. Now why is this a good thing?
Put simply, abstraction opens up additional solution concepts. For example, we’ve now opened up the possibility of a pre-scheduled daily lunch box drop-off, or of a meal kit that allows quick preparation of a fresh meal, or of a club in which a group of five people take turns making lunch for each other once a week. By broadening the definition of the problem, we have opened up the possibility of many more alternative solutions.
But why stop there? What is the benefit of providing readily available lunch? Well, perhaps a key motive is to increase available work time during the day? So, we could rephrase the job to be done as “How might we increase available work time during the day?” That would open up even more solution directions, maybe a virtual personal assistant to help with mundane tasks, professional or otherwise.
Of course, even this statement can be broadened. How might we be more productive? How might we better provide for ourselves and our families? As we ask why we would want to do a job, we broaden the problem definition until eventually we end up with jobs to be done like how might we improve well being in society?
Note that these increasingly general statements are not always strictly arranged on rungs of a linear abstraction ladder. There are typically many motives for any particular job to be done. Maybe a more significant motive for our target customer is to be able to control diet, or to introduce meal variety, or to enjoy more delicious food. Any given statement of the job to be done is located in a network of alternative problem statements, some more general, and some more specific.
So far in this example, we’ve always moved from more specific to more abstract, the why direction on the abstraction ladder. But, you can also step down a rung or two on the abstraction ladder by asking how — or what approach might we take to do the job. For instance, for the job to be done allow work-from-home professionals to enjoy more delicious food, we could take the approach of providing them with freshly cooked meals. That’s a more specific statement of the job to be done: How might we provide work-from-home professionals with freshly cooked meals?
When is the job to be done too abstract?
Stating the job to be done more abstractly, and thereby opening up additional solution concepts seems like a great thing. But, at what point is the job to be done too broad, too abstract? If you state the job to be done as “How might we improve well being in society?” then a solution might be to provide free neck massages in waiting lines at the airport. Although I might use that service as a customer, somehow that solution would not motivate me to quit my job and start a company. You, specifically, as an entrepreneur have a vision, and if the job to be done doesn’t align with your vision, you’re veering off track.
When you set out to create or improve something, it’s motivated by a gap you have sensed. You own that gap. If you embark on a process to create something that improves the well being of individuals in society, and it does so, but it does not achieve your goals, then you have defined the job to be done too broadly.
Step-by-step process for using the abstraction ladder
State the problem top of mind using “How might we…” For example, how might we periodically deliver a supply of prepared soup to work-from-home professionals?
Now, ask yourself what desirable outcome would be achieved if you solved that problem, and use that desirable outcome as the foundation of a second, more abstract, problem statement — “How might a work-from-home professional always have something available to eat for lunch?”
Now, repeat step 2… For example, “how might we increase the available work time for work-from-home professionals?” Repeat again and again until the problem statement is something like “How might we increase well-being among members of the community?” the most abstract possible motive for solving the problem. In this step, you might use self-stick notes placed on a wall with each note capturing a different job to be done. Place the notes in a hierarchy or network with more abstract statements higher on the wall. Remember that there may be several motives for doing a job — so your abstraction ladder may branch out as you consider alternative how-might-we statements.
Don’t be too hung up on the details of the process. Your goal is to explicitly articulate and consider several alternative problem statements, some more abstract and some more specific. If an alternative job to be done comes to mind, just write it down and put it on your work surface.
After all that divergent thinking, it’s time to converge. Deliberately choose the most abstract statement of the problem that if addressed would still satisfy your personal vision and goals as an entrepreneur. That statement is the job to be done.
I’ve described this process as a single effort that is one and done. In reality as you proceed in developing the opportunity you may find that you benefit from further broadening or focusing of the job to be done to better align with your mandate and vision as you better understand it.
Notes
Christensen, Clayton M., Taddy Hall, Karen Dillon, and David S. Duncan. “Know your customers’ jobs to be done.” Harvard business review 94, no. 9 (2016): 54-62.

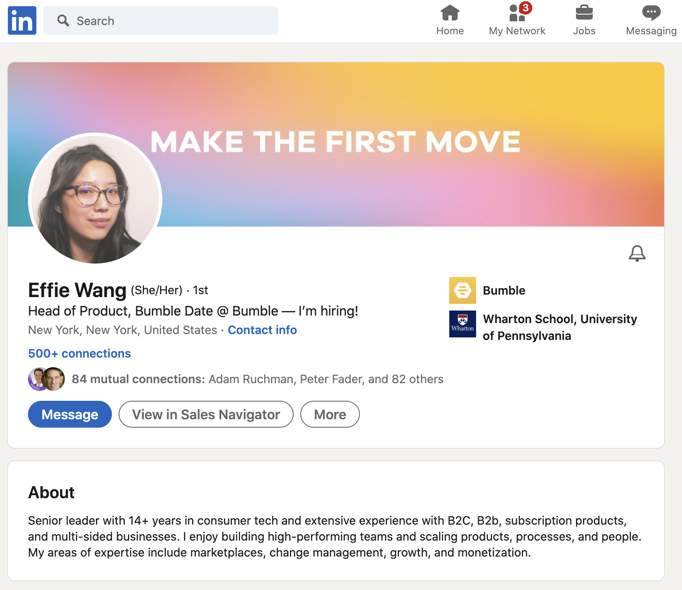
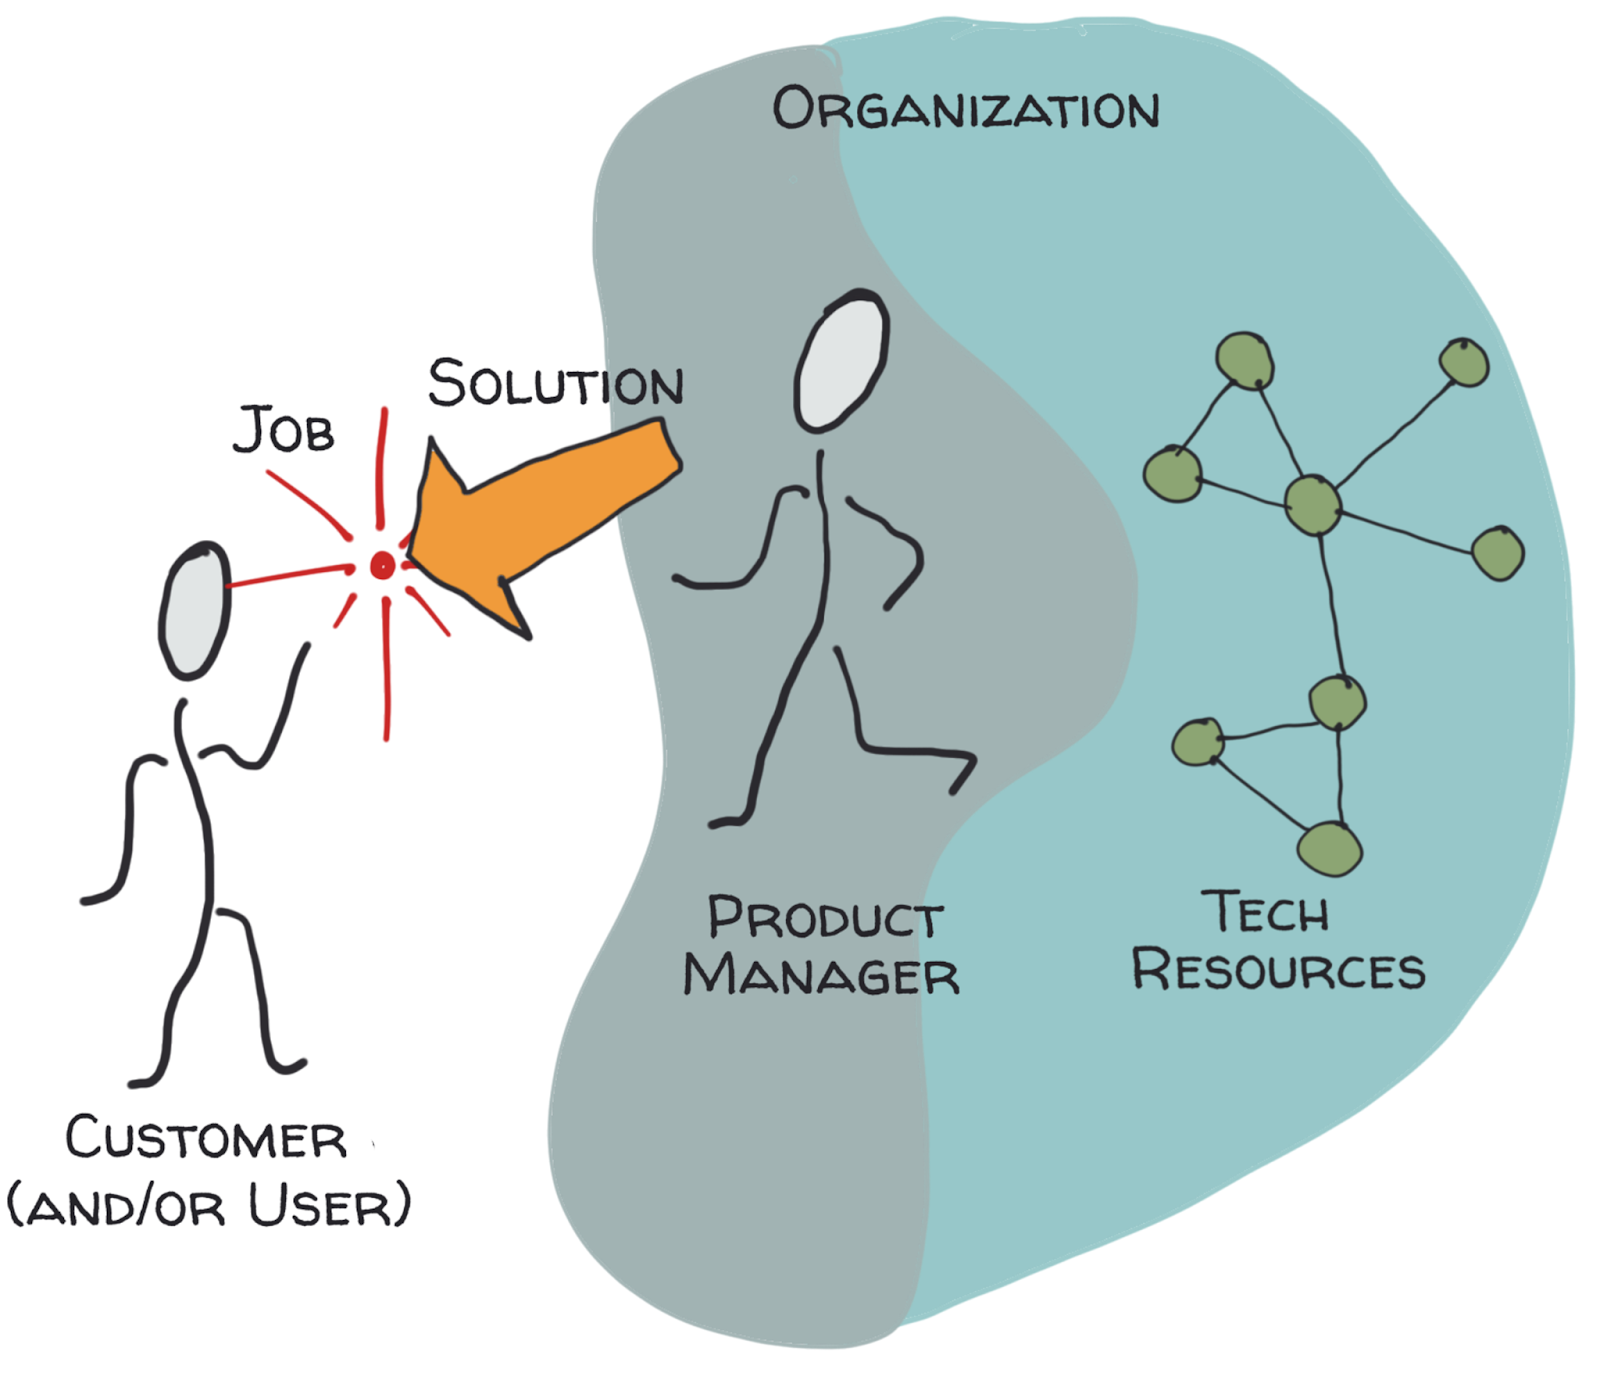
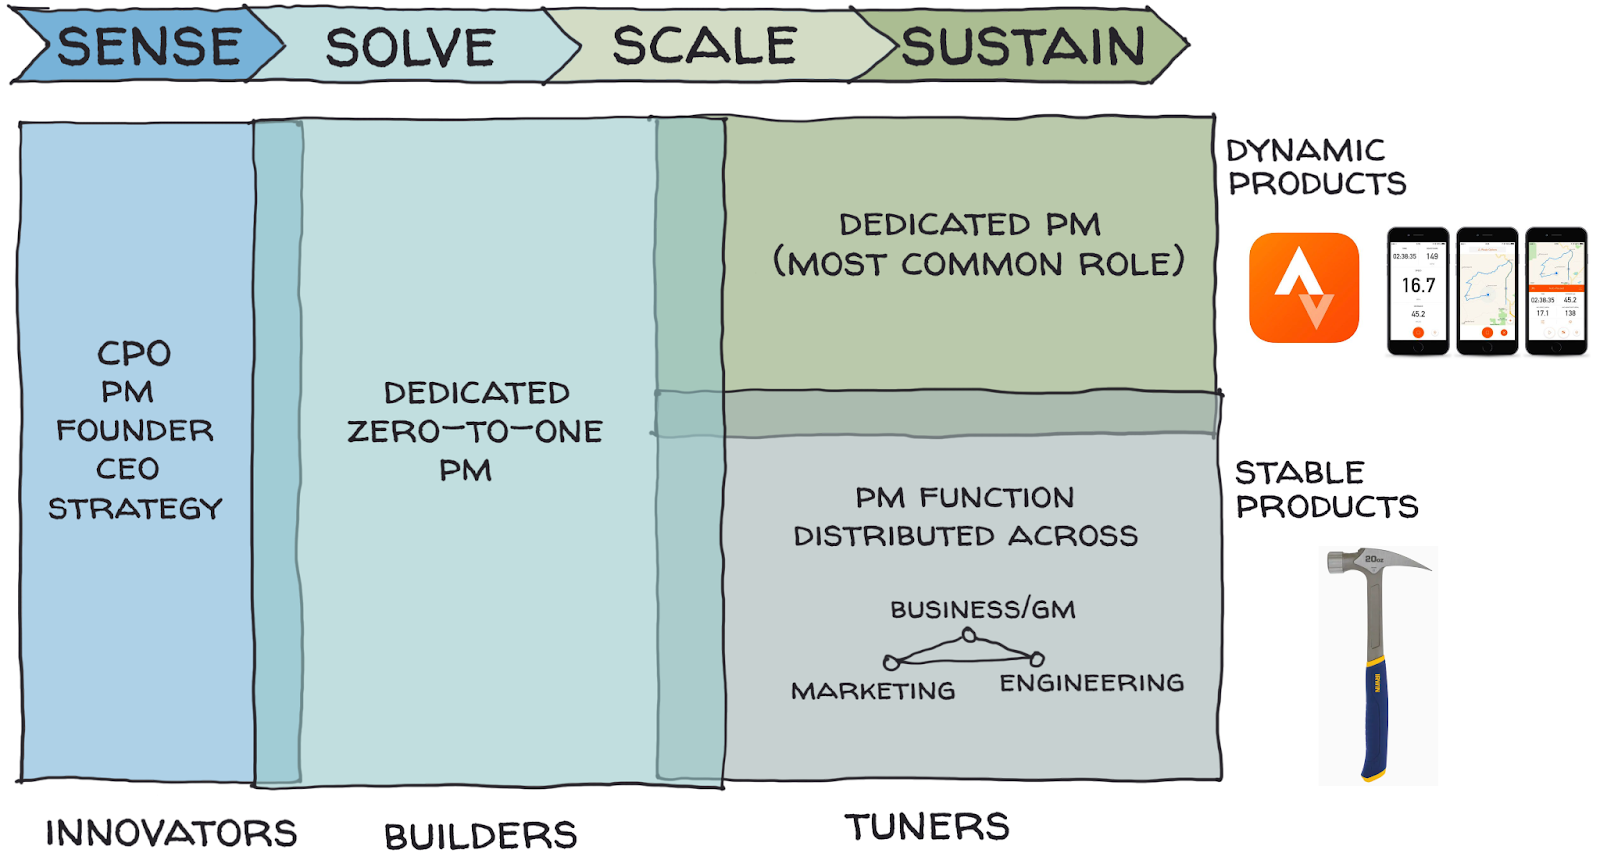


